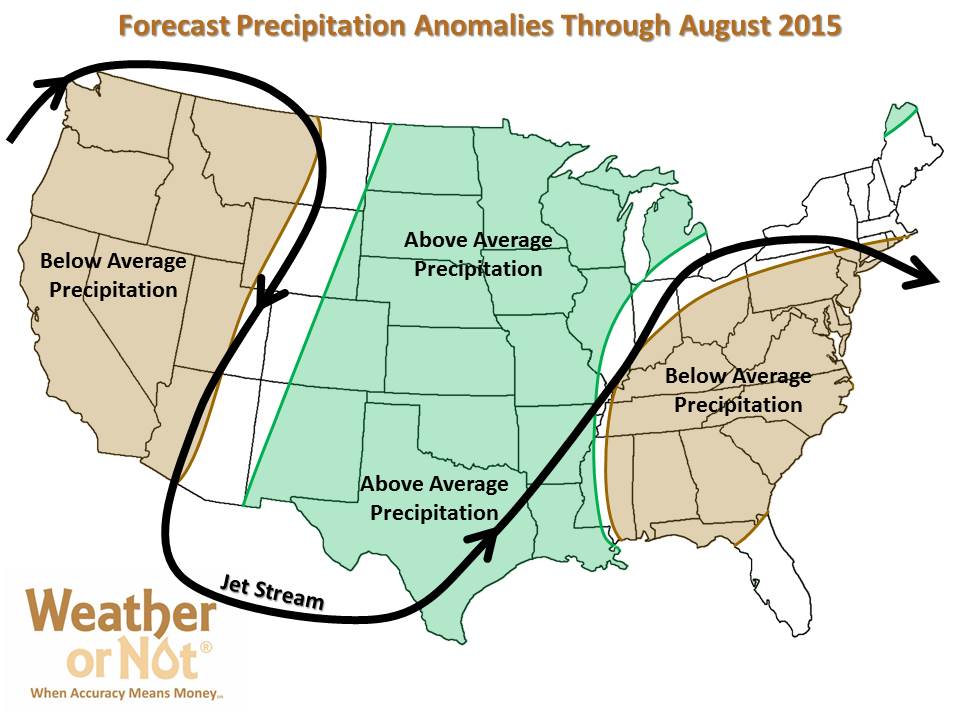
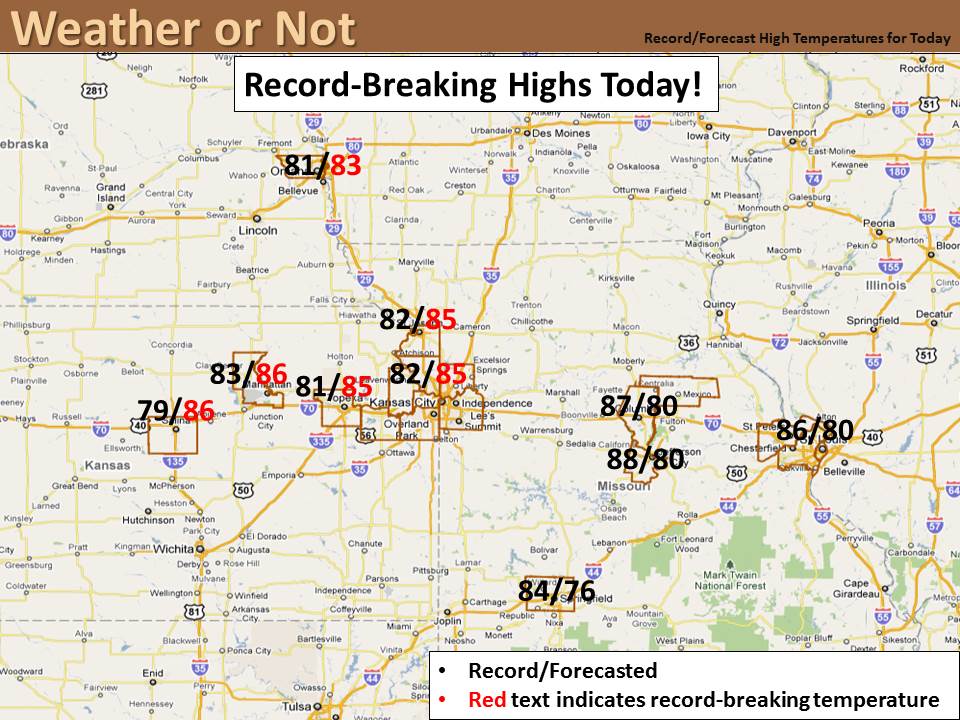
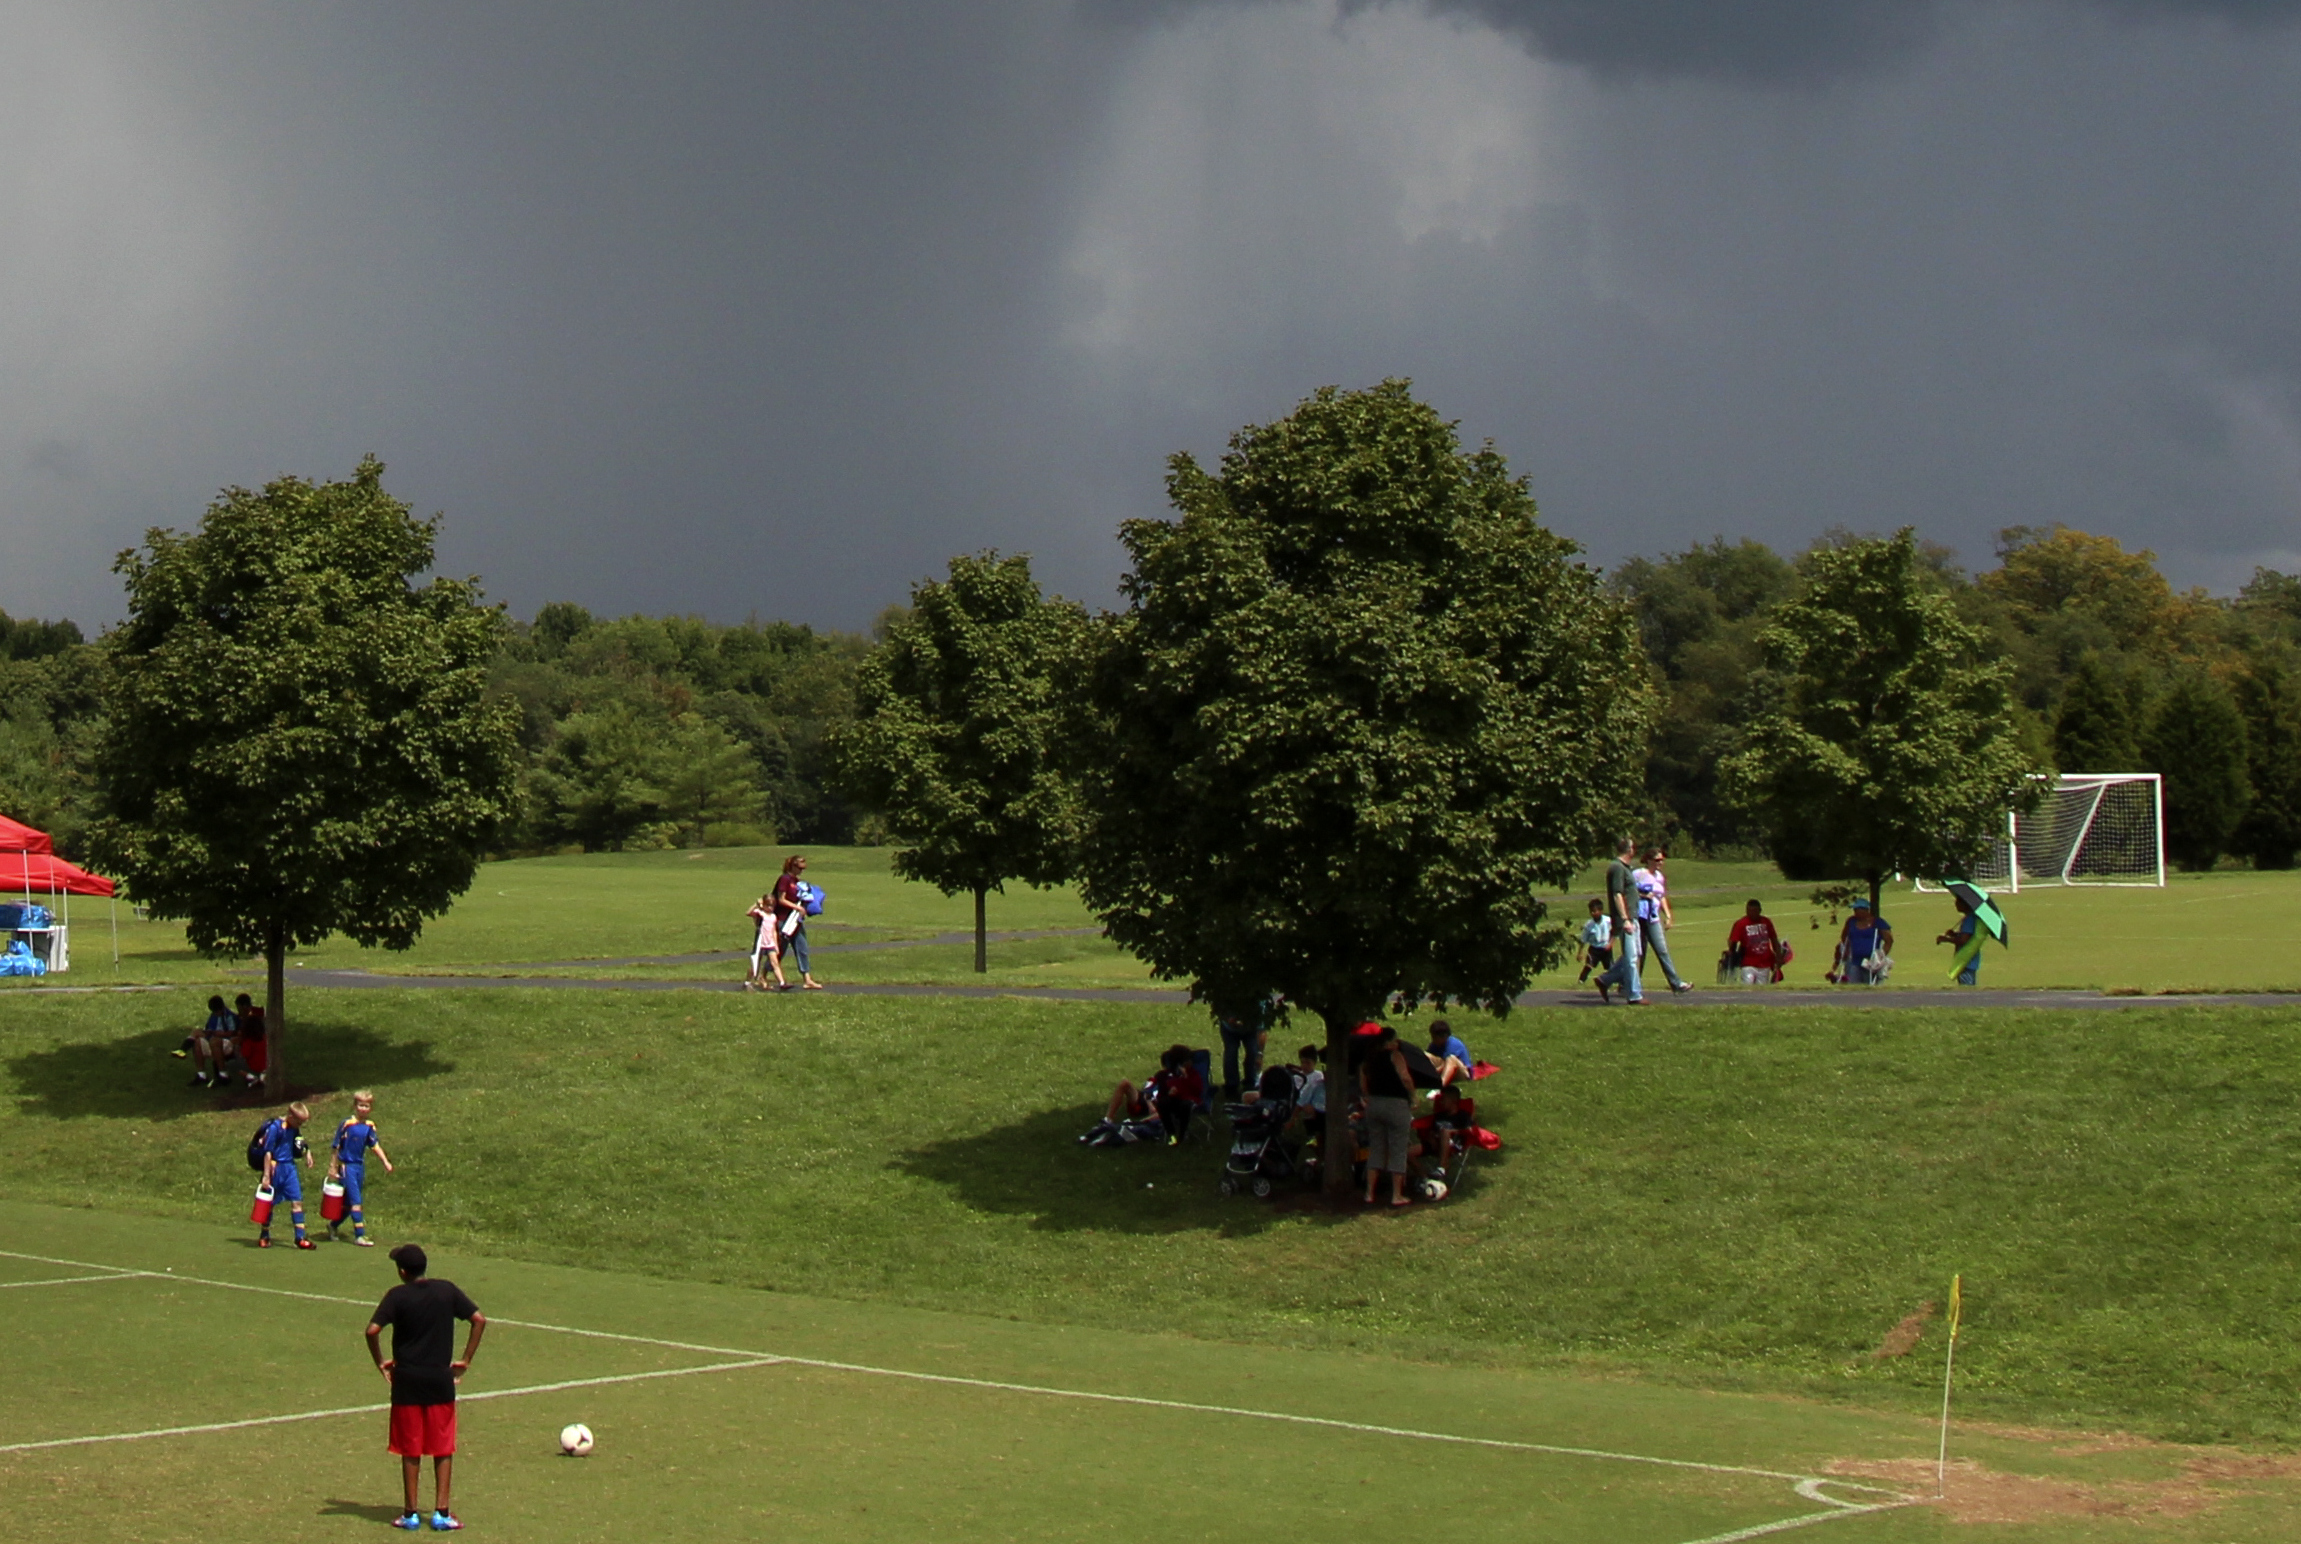
Fall is upon us!

Fall is upon us!  Football season has begun and the Royals and Cardinals are getting ready for the playoffs.  Everywhere you look you can purchase pumpkin spice something, SO even if it might not feel like it yet, today is the Autumnal Equinox.   What exactly is the Autumnal Equinox, or what is more commonly referred to as Fall? The astronomical season Fall for the northern hemisphere begins on Wednesday, September 23rd and ends on Monday, December 21st with the winter solstice. An equinox is the point in time when daylight and darkness are equal for all latitudes on Earth.

Equinox vs. Solstice


Even though we’ve got warmer than normal temperatures scheduled through mid-October, a cool down is guaranteed to be on its way!   For the beginning of the season in Kansas City, the average high and low temperatures are 76 and 54 degrees respectively but, by the end of the Fall season, the average high and low temperatures will have dropped to 39 and 21 degrees respectively.

Slide1

Average precipitation rates drop during the fall months, but the average monthly snowfall totals start to rise.

Slide2Slide3

When planning your operational schedule for fall you’re going to need more than averages!  We’ve developed a Mid-Range forecast that can show you what days to plan outdoor activities and when you may need to drag out the snow removal equipment.  Interested?  Give us a call at 913-722-3955.


Is Your Lightning App a Liability?

September 18Storm_Soccer11, 2015

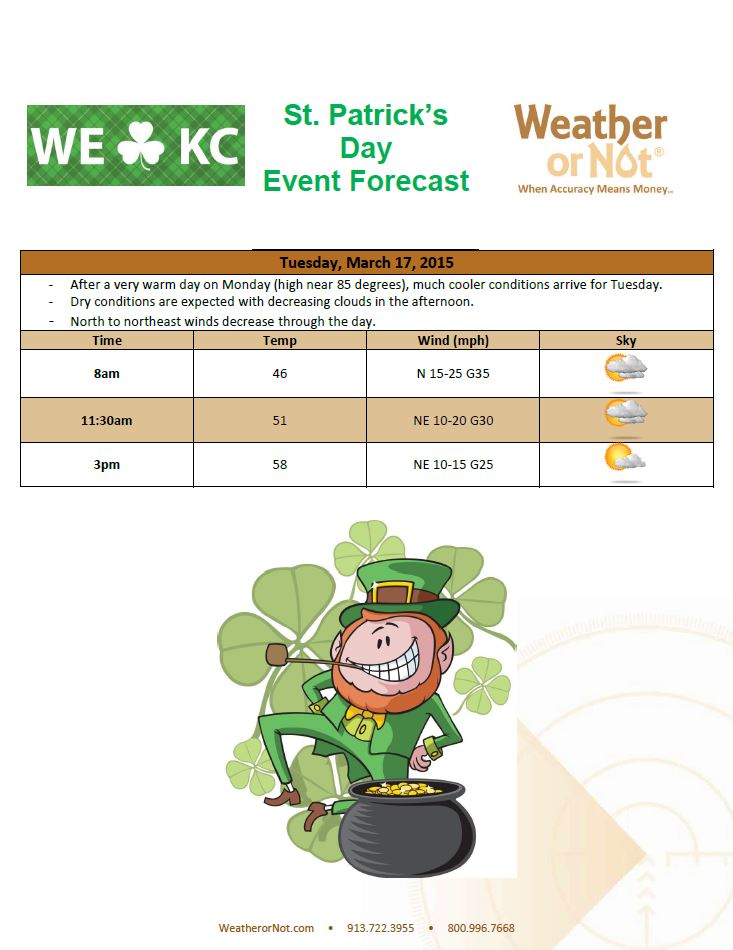
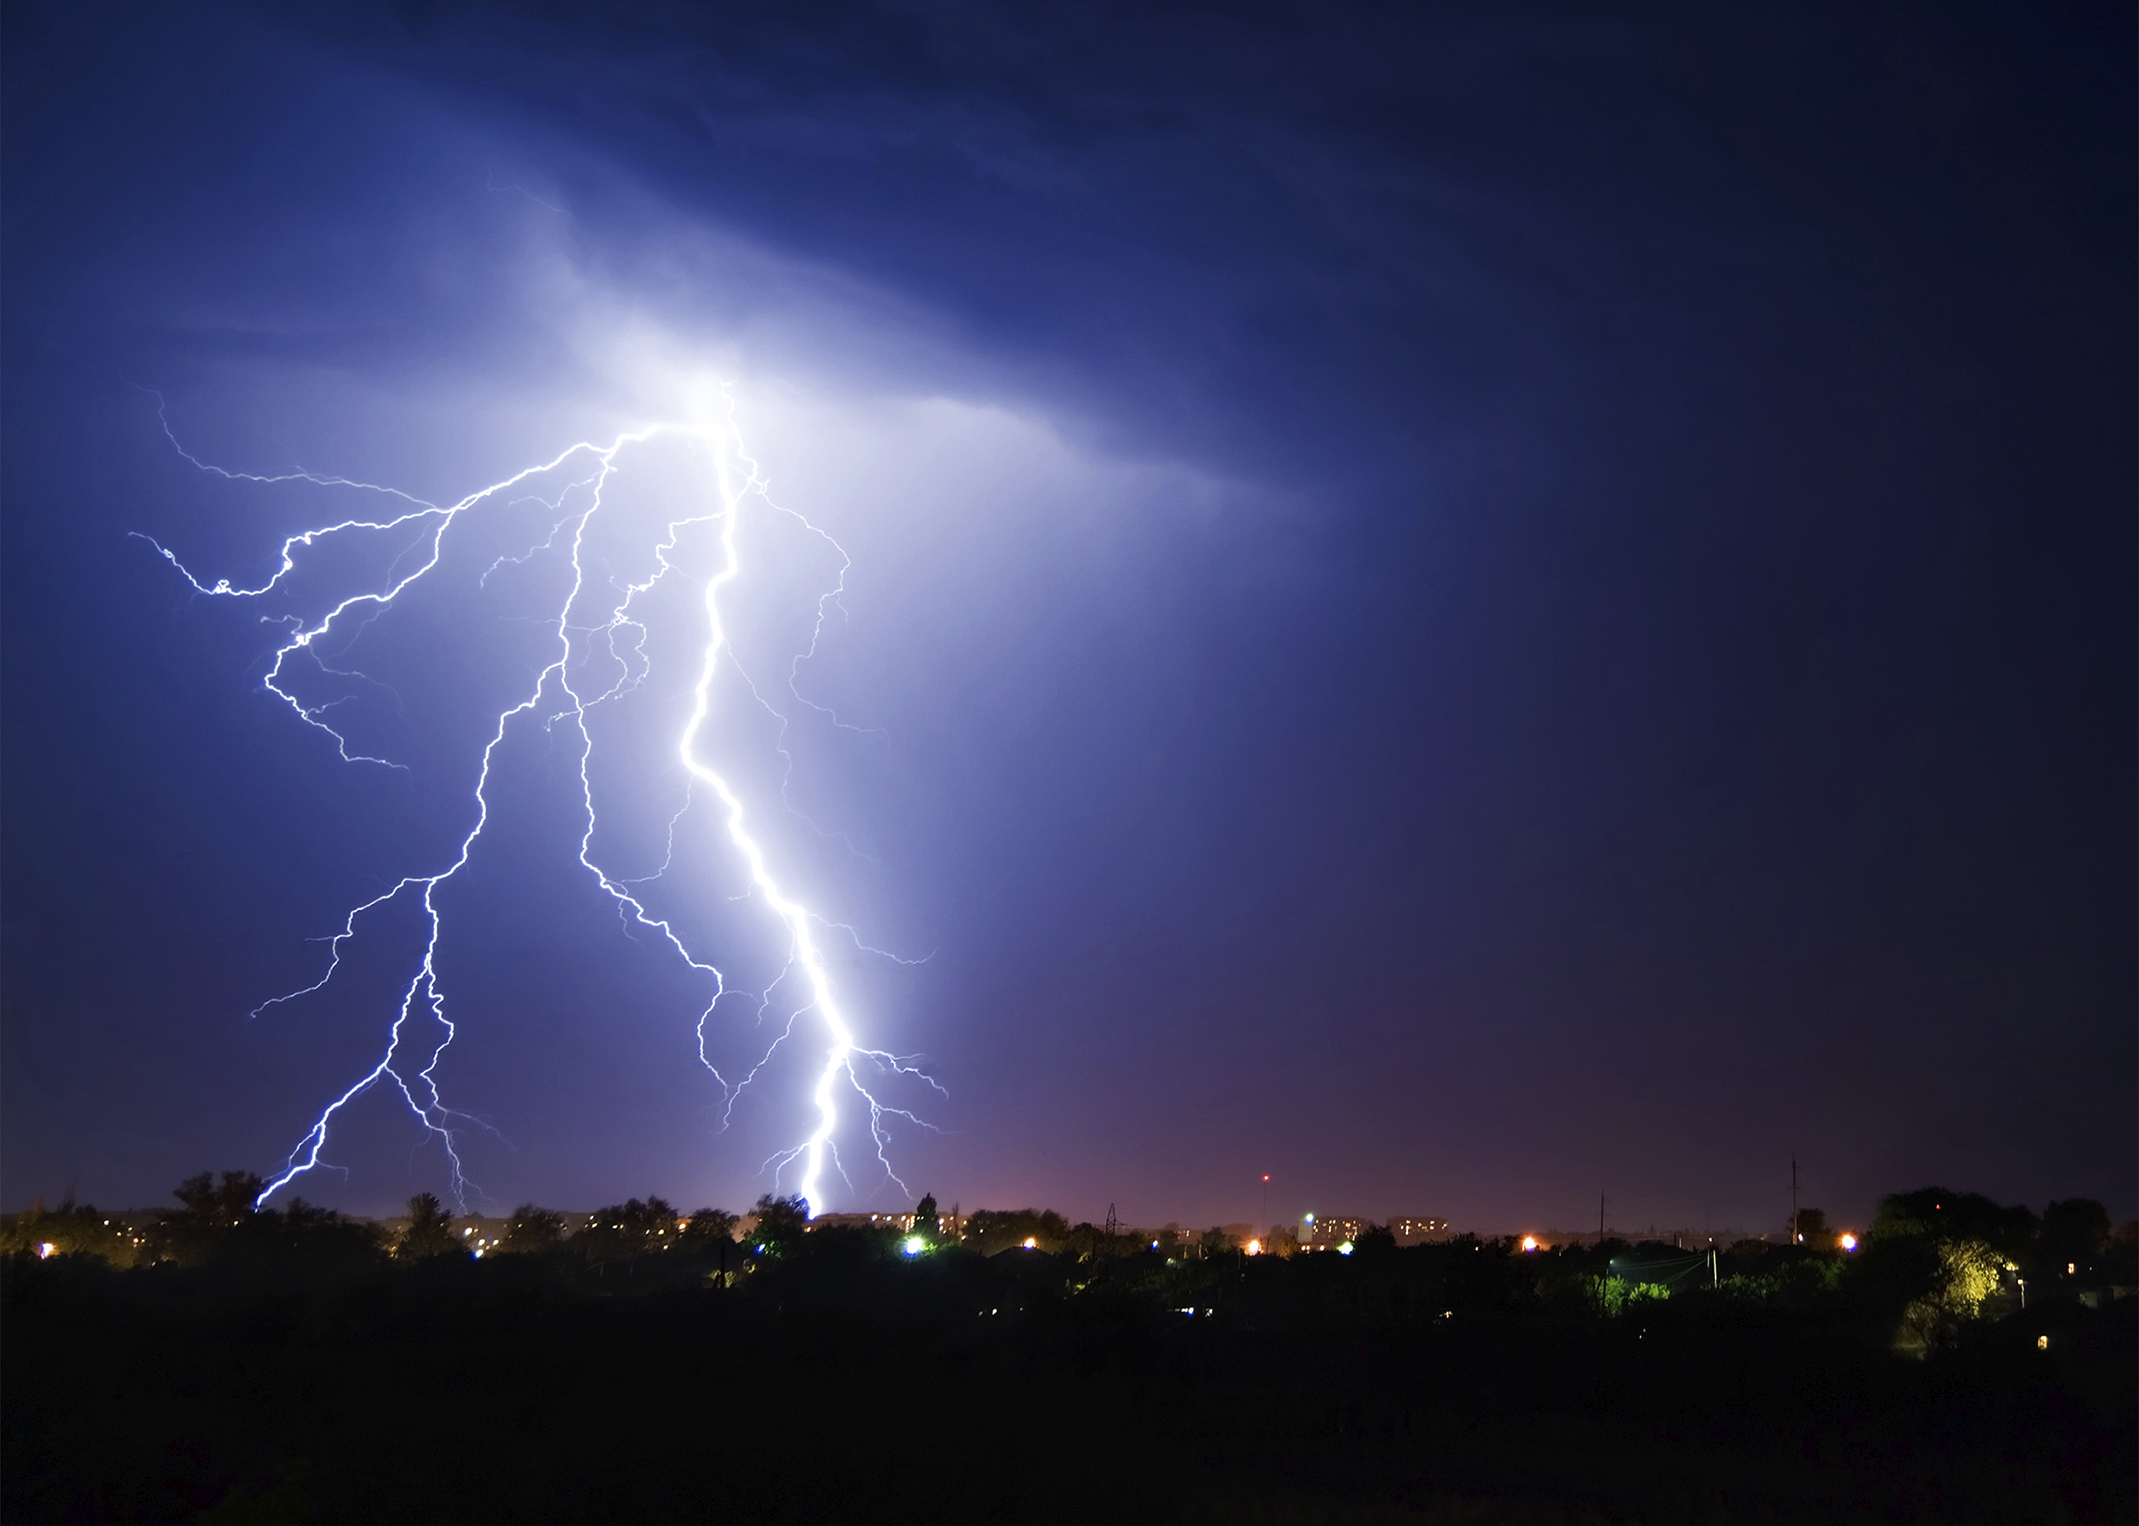
Many of today’s lightning apps offer excellent safety information: distance between you and the nearest strikes, recent motion of lightning strikes, overlays of strikes to radar and so on.  However, many of those apps depend on you to request an update.  Few actually send an alert to you.  That’s one of two serious risk management dangers!  Let’s review those dangers and how to eliminate them from your businesses liability.

 The app depends on you to update

First let’s address the pull vs. push technology challenge.  Sure, lots of people love to hit the update button as if it were a mental morphine drip.  It allows them to look smart to their friends or colleagues at a ballpark.  “Hey, see this?  The lightning is 20 miles away.  We can keep on playing!”  What if that person gets distracted by clicking onto another cool app on their phone or gets caught up in a conversation with others while the lightning moves in faster than expected?  Their timeline to safety has been jeopardized resulting in people scrambling for their cars hoping not to get struck by lightning.

The safest weather solutions never depend on somebody clicking an app at the right time to give people the best lead times to avert danger.  Push technology allows people to go about their business knowing that when their thresholds are met, they’ll get an audible alert.  Having a noise, one you can customize so you can tell the difference between a life-saving lightning alert and chatty text from a friend is technologies way of having your back.  You, your patrons and colleagues will be safer with reliable alerts that were pre-set to critical thresholds.  Better yet, set 2 thresholds, one for the heads-up when lightning is further away but demands that you keep an eye on the sky for when the storm gets closer.  The other threshold should be your “take shelter” threshold.  When this alert goes off, it’s game over – no questions asked.  The best professional lightning detection systems also offer an “all clear” notification.  Meteorological studies recommend setting your “all clear” to 30 minutes after the last strike inside your “take shelter” area.

How do you Know the Coach is Monitoring Lightning?EN_sample

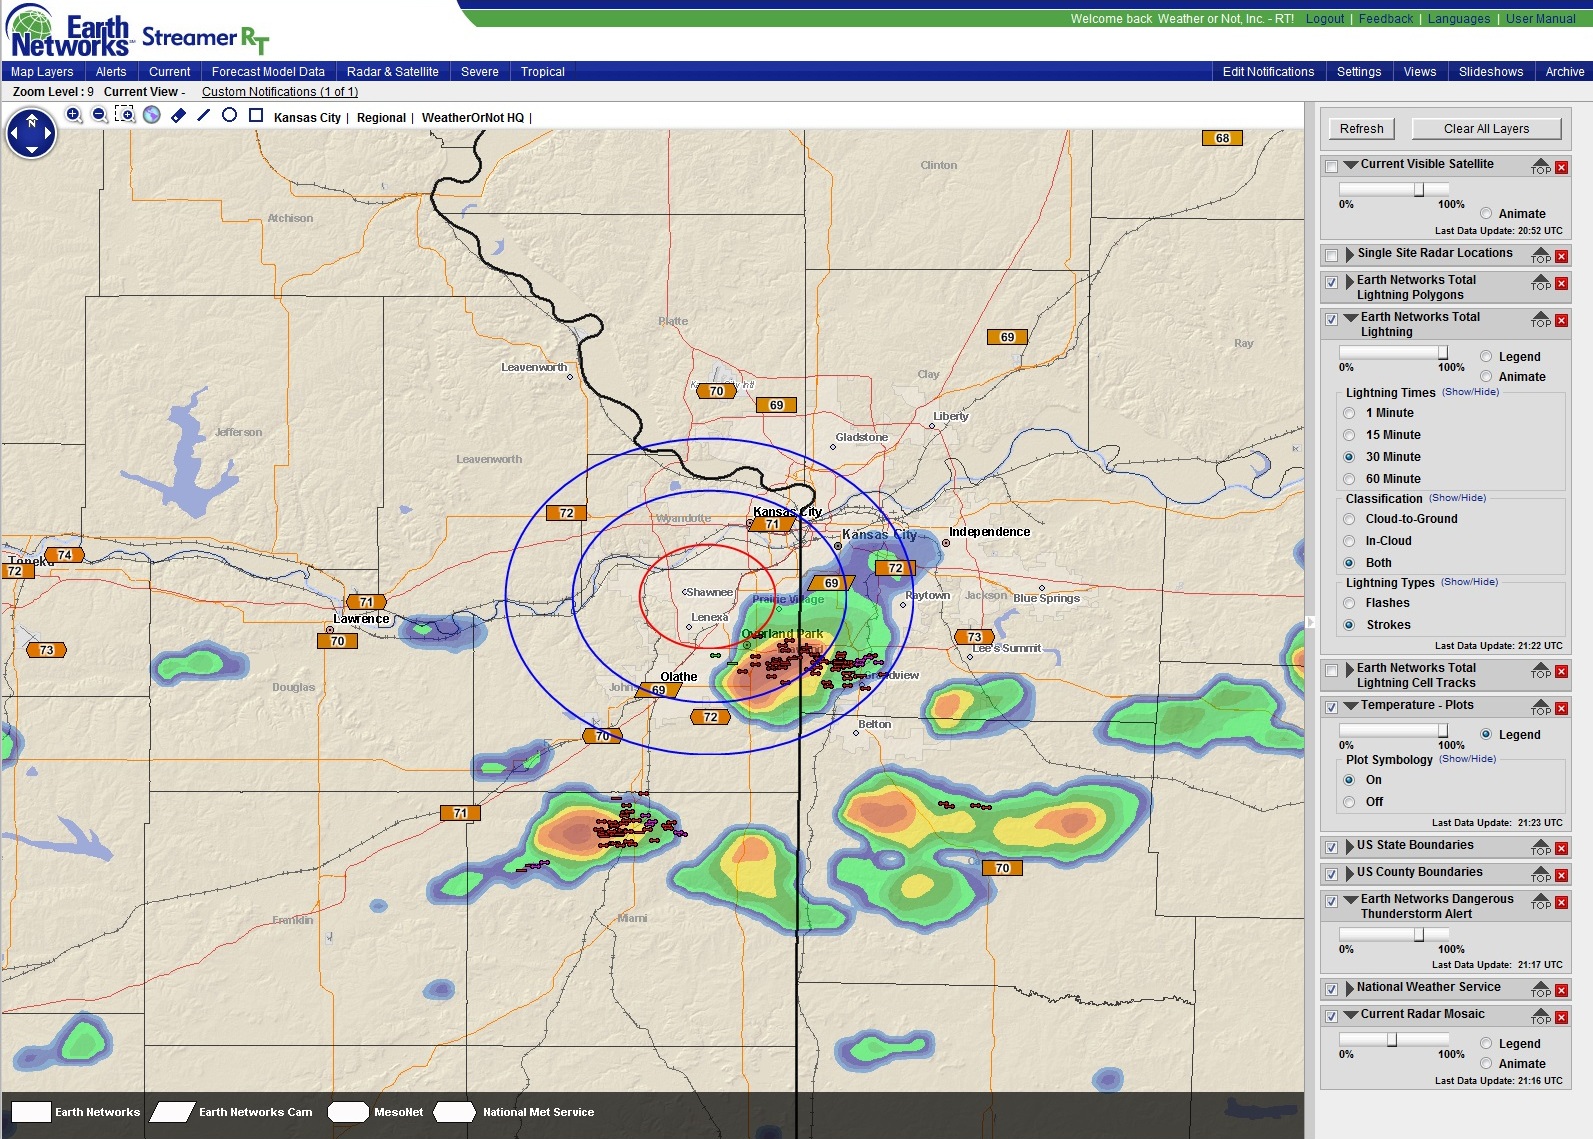
Another unnecessary but often ignored risk is assuming that someone on your staff is monitoring lightning. “Our coaches have a lightning app,” is a very common remark these days?  How can you be sure?  If your organization will be held legally responsible for the safety of its patrons, you’d best be supplying the on-site decision makers with the tools required.  Then match those tools, such as a robust application (not an app but a complete software suite) that allows you to control who gets what notifications based on the thresholds you set.  Those thresholds should match your lightning policy.  They should also be communicated as part of the safety and communications training at your ball field, school, golf course, etc.

In summary, the best way to assure lightning safety at your site and protect your business or organization’s liability is to make sure that you, the owner or manager, controls how and when your on-site decision makers will be alerted to danger, take shelter, resume or cancel activities.

For Organizational Lightning Safety                         

Take Charge! Provide the policy, tools and communication that everyone must abide by if they want to play on your team.  Leaving any of that to chance could be dangerous for your patrons and an invitation for a lawsuit.  If we can help you avoid either, don’t hesitate to get in touch.


Sara Croke

President

913-722-3955

sara@weatherornot.com


The Relevance of El Niño, Part 2 – What Kansas City Winters Tell Us About El Niño

2015 KC_10yr Snow Graph
Can you tell which winters were El Niño or La Nin᷉a induced?

You know what happens when you assume……

People assume that winters during El Niño cycles are mostly dry in the Midwest and that La Nin᷉a cycles keep us constantly shoveling and plowing.

If your businesses bottom-line or operational decisions are weather dependent, such assumptions are dangerous!

El Nino Winters

Remember the Christmas Blizzard of 2009*?   Well, that was a winter with a moderate El Niño (a strength of +1.3°C).  The overall winter in KC topped out at a whopping 44.3″ at KCI!  The 30 year normal is 18.9″.

The La Nin᷉a induced winters have also shown anomalies in Kansas City.  Three of those winters registered below normal snowfall.  One of them, 2011-12 had less than 4″ of snow – ALL winter!

La Nina Winters

Even the neutral years, with no El Niño or La Nin᷉a, failed to offer a conclusive relationship regarding snow accumulations.

Neutral Winter

Our meteorologists in-depth review of the last 10 years proves to business decision makers just how dangerous using only one variable, such as El Niño, can be when making operational assumptions regarding potential snowfall.


*Read more about how our meteorologists helped KCI Beat the Christmas Blizzard of 2009!


The Relevance of El Niño, Part 1 – What are El Niño and La Niña?

In an effort to separate hype from science, Weather or Not’s meteorologists have closely examined the relationship between the 10 most recent Midwest winters and El Niño/ La Niña.  In part 1, we’ll define the often misinterpreted phenomena.

ENSO-states-vizEl Niño is characterized by unusually warm sea surface temperatures (SST) in the Equatorial Pacific Ocean.  An increase in SST over a 3-month period greater than 0.5°C above the average temperature of the ocean is considered to be the minimum criterion for El Niño classification.

On the other hand, La Niña is described by uncharacteristically cool SST in the Equatorial Pacific Ocean. A decrease in SST over a 3-month time frame more than 0.5°C below the average temperature of the ocean is considered to be the minimum guideline for La Niña classification.

A Neutral cycle is considered to be any change in SST over a 3-month period within ±0.5°C of the average ocean temperature.

Even though El Niño and La Niña are SST patterns observed in the Pacific Ocean near the equator, they can have very real effects on the weather in the United States. With all of the hype about El Niño in the media right now, many of the real effects of an El Niño have been lost in translation or blown out of proportion.

In Part 2, we’ll separate fact from fiction as it relates to the assumptions you can reasonably make for your business this winter.   The results might surprise you!


Wx Tip #2 – What You See Isn’t Always What You Get!

“I have radar”! That convenient feature has spawned many people into believing that they have the weather answer as soon as they tap their favorite app.  However, what you see isn’t always what you get.

Most people know that the more orange and red they see on the radar, the more likely that the rain is much heavier in intensity.

Seems simple enough, right? What these apps don’t tell you is that their radar feature is most likely a composite reflectivity image.

A composite reflectivity image takes the highest intensity reflectivity it sees (several locations) and combines them into one image. This can be misleading because precipitation that the radar detects at the higher tilts often does not reach the ground, but is still displayed on the composite reflectivity image. This can make it look like you are going to get rain, when in reality you won’t get any precipitation at all.  That can be very costly to construction companies or snow removal crews!

Using a base reflectivity image can help you solve this dilemma.  A base reflectivity image is the actual display of what the radar “sees” in one tilt.  So as a result, when the radar rotates at its’ lowest tilt in the atmosphere, you will only see the precipitation that is present in that lowest level. Since much of the reflectivity that is visible in the lowest tilt of the radar does reach the ground, this can be very helpful in discerning whether or not you are going to get weather or not!

Decision Making Tip:  Use the “composite radar or regional view” to get a heads-up for potential inclement weather impacts for your business operations.  Then monitor your local radar (single radar site) on the base reflectivity option for a more precise more realistic representation of precipitation that is truly reaching the ground.

Although professional meteorologists rely on much more than radar to help companies make the safest and most profitable decisions, using this “composite versus single site” radar tip could make you look a little smarter the next time you pull out your smart phone as the sky darkens.


Wx Tip #1 – Averages Can Be Deceiving

Summer 2015 Patterns - TemperaturesOooh Boy – a cool summer is coming to the Midwest! Not so fast – averages can be deceiving.

This summer, the Midwest will experience, on average, below normal temperatures.


Summer 2015 Patterns - Precipitation


The already saturated ground and continued above average rainfall will cause the heat indices to be quite high.  Hence, a below normal high temp of 90 may feel like 105 when factoring in humidity. Construction, turf, recreation and landscape managers need to be careful to use the right numbers when planning outdoor work for their employees.


Below Normal Temps + Above Normal Precip = Misery  


Below Normal Temps + Below Normal Precip = Comfort


Soaking Pattern – Get Used To It!

June 24, 2015

If the Midwest rainy spring washed away your profits, you must change your strategy now because Mother Nature’s screaming –  Get Used To It!

The damp pattern which began in April became a soaking pattern May through Mid-June.  While job sites are buzzing with activity today, Project Managers need to reevaluate their work schedules around this summer’s weather so they can end the year in the black.

Here’s what’s in store:  Expect a cooler, wetter summer

Summer 2015 Patterns - Precipitation


Mother Nature 1 – Marlins 0

Lightning - Stock

Mother Nature       1

Marlins                   0

Weather APPS are great for consumers’ convenience but costly for businesses.  By now you’ve probably heard how the Florida Marlins boosted the egos of professional meteorologists when they soaked their field and fans Opening Day.  Three executives, using weather APPS, forecasted dry skies for their stadium.  Mother Nature dumped on them.  They then scurried to close the retractable roof but it was too late.

Stop beating up on the Marlins’ executives’ decision.   It wouldn’t take a Billy Bean statistician to calculate that there are tens of thousands of businesses who continue to make the same costly decision: I don’t need to a pay a professional weather consulting service because I have an APP for that!

When is a weather APP appropriate for you?  If inconvenience is the only liability you have to a bad weather related decision, go for the APP!  Sure, it’s not fun to be caught without an umbrella but so what?  It’s not affecting your profit and loss statement.  You’ll likely get a great return on your investment (ROI) plenty of times when you stuff a jacket in your golf bag or throw in extra tee shirts for a trip to an unseasonably warm northern city.

Here are a few examples from the 3 primary considerations businesses need to examine when weighing the professional meteorologists at their call against the APP in their pocket.

Hard Costs:    Business shut downs, delayed inventory &  production,  wrong inventory for retail, materials such as concrete, asphalt, etc., airport closings, labor…..

Soft Costs:  Unnecessary cancellations of  school, rescheduling community ballgames, delaying re-opening of roads and other projects that aggravate your citizens, scrambling to move outdoor events indoors when possible….

Reputation:  Opening Day is seen as the best PR opportunity for every professional team.  After all, it feels like everybody’s batting a thousand before the first pitch. Technically, it’s .0000 but you get our meaning.  Warren Buffett is famous for hammering home the benefits  of protecting one’s brand.  The Marlins learned that lesson the hard way.  Do you want your chief executives growing your business or trying to save face for the company with broadcasters, Twitter followers and blog posts?

Private weather consultants are not necessary for every company.  However, after Opening Day, it’s definitely time for business executives to re-examine how Mother Nature could affect their bottom line.  You can’t change the weather but you can change how the weather affects your business.  We know.  We’ve been doing this for nearly 30 years for major league ball clubs, defense contractors, airports, schools and more.  It’s based on a simple concept:  Your pain drives our protocol. If Mother Nature can cause you great pain, get the right solution before the next storm.  That’s how businesses align their risk mitigation investments with a positive bottom line.