August 23, 2012
The personal and economic effects of our desperate need for water keeps drought related stories trending this summer. You will see the latest Drought Monitor posted by the media, meteorologists and others alike that indicates classifications for areas that are in moderate, severe or exceptional drought. What does an exceptional drought or a severe drought actually mean?
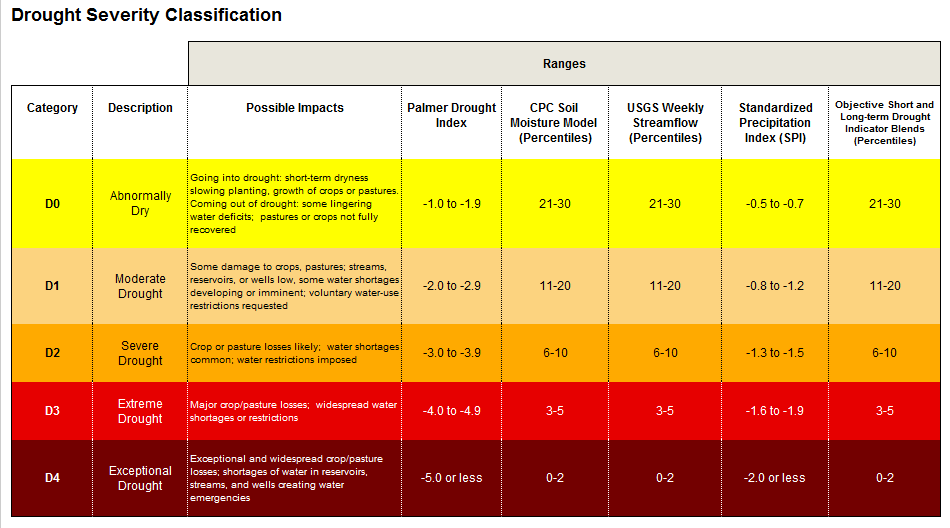
The labels are determined by using five key indicators, along with several other supplementary indicators, to determine the category of drought. Examine this graphic, courtesy of the University of Nebraska-Lincoln, on each of these indicators and their corresponding values to a drought category.

What do each of these indicators represent?
Palmer Drought Index: Attempts to measure the duration and intensity of long-term drought-inducing patterns. Not only taking the latest weather pattern, but patterns from previous months to determine a cumulative value ranging from over 5 (extremely moist) to less than -5 (extremely dry). The index doesn’t just use precipitation either, it considers evaporation, runoff and other details too!
Soil Moisture Model: The Climate Prediction Center uses data from 1932-2000 to determine a soil moisture percentile given the current conditions. Percentiles are a comparison of current conditions to those of the past, meaning if the soil moisture is in the 0-2 percentile it is one of, if not the, lowest soil moisture that has ever been recorded for that location.
USGS Streamflow: Another percentile, this one from the Geological Survey based upon streamflow of numerous rivers and streams throughout the United States. The percentile is based upon at least 30 years worth of data for any specific streamflow station and just like the soil moisture percentile, low numbers are an indication of drought conditions.
Standardized Precipitation Index: An index that is determined by only one source, precipitation. This indicator is based upon the probability of recording a given amount of precipitation for several time scales (from 1 month to 24 months) with negative values indicating drought conditions.
Objective Indicator Blends: Likely the most complex indicator used takes into account both short term (1-3 months) and long term (6-60 months) time periods and is based upon many indices including precipitation, topsoil moisture, vegetation health index and other drought indices too.
All of these computerized calculations and numbers don’t always agree on the drought category, and that is why the final determination is given by numerous climatologists from around the nation. Have a question about the drought or the drought monitor, feel free to ask us!


