Is this the beginning of another Dust Bowl?

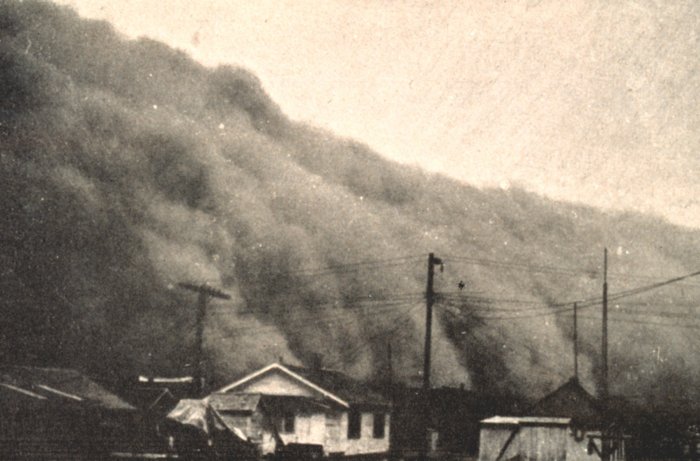
Dust Bowl - Kansas 1935

August 24, 2012

We’ve been hearing comparisons of this year’s drought to the Dust Bowl of the 1930’s all summer.  Are they really comparable?  While this year’s drought is extreme, it is still far from the peak of the Dust Bowl in 1934, which ranks #1 in terms of U.S. area covered by drought conditions.  In fact, July of 2012 ranks #20 in terms of area under moderate or worse drought conditions and #28 for area under severe or worse drought conditions.

Take a look at the Top 10 years for area of the contiguous U.S. covered by moderate or worse drought:

1) July 1934 – 79.9%
2) December 1939 – 62.1%
3) July 1954 – 60.4%
4) January 1955 – 58.3%
5) January 1940 – 57.7%
6) December 1956 – 57.6%
7) July 2012 – 57.2%
8) September 1931 – 54.9%
9) August 1936 – 54.4%
10) May 1925 – 54.0%


And the top 10 years for area of the contiguous U.S. covered in severe or worse drought:

1) July 1934 – 63.1%
2) September 1954 – 20.1%
3) December 1956 – 43.2%
4) August 1936 – 42.7%
5) January 1935 – 39.9%
6) January 1955 – 39.1%
7) July 2002 – 38.5%
8) July 2012 – 37.6%
9) August 2000 – 36.7%
10) July 1988 – 35.6


Could the Dust Bowl ever happen again?  Researchers say unlikely, as the Dust Bowl was largely contributed to lack of erosion-controlling farming practices and drought-sensitive crops such as wheat.  Agriculture was relatively new to the  Great Plains, and farmers were rapidly replacing native prairie grasses with wheat fields.  As the drought continued to expand and persisted the wheat fields failed, leaving exposed and barren top soil that was swept up by winds across Kansas, Oklahoma, Texas and other areas.  In fact, some researchers have indicated that humans helped cause the drought and heat in the 1930s due to the increasing barren land, along with the dust that was present throughout the atmosphere.  Much better farm practices and more drought-resistant crops will likely hinder a Dust Bowl scenario from ever happening again.

Exceptional Drought? How do they decide?

August 23, 2012

The personal and economic effects of our desperate need for water keeps drought related stories trending this summer.   You will see the latest Drought Monitor posted by the media, meteorologists and others alike that indicates classifications for areas that are in moderate, severe or exceptional drought.  What does an exceptional drought or a severe drought actually mean?

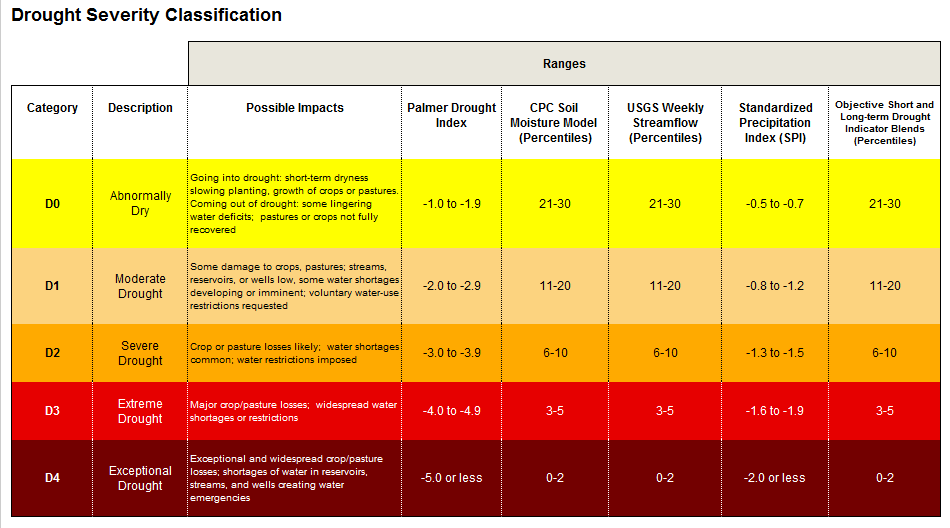
The labels are determined by using five key indicators, along with several other supplementary indicators, to determine the category of drought.  Examine this graphic, courtesy of the University of Nebraska-Lincoln, on each of these indicators and their corresponding values to a drought category.

Explanation of the US Drought Monitor

What do each of these indicators represent?

Palmer Drought Index:  Attempts to measure the duration and intensity of long-term drought-inducing patterns.  Not only taking the latest weather pattern, but patterns from previous months to determine a cumulative value ranging from over 5 (extremely moist) to less than -5 (extremely dry).  The index doesn’t just use precipitation either, it considers evaporation, runoff and other details too!

Soil Moisture Model:  The Climate Prediction Center uses data from 1932-2000 to determine a soil moisture percentile given the current conditions.  Percentiles are a comparison of current conditions to those of the past, meaning if the soil moisture is in the 0-2 percentile it is one of, if not the, lowest soil moisture that has ever been recorded for that location.

USGS Streamflow:  Another percentile, this one from the Geological Survey based upon streamflow of numerous rivers and streams throughout the United States.  The percentile is based upon at least 30 years worth of data for any specific streamflow station and just like the soil moisture percentile, low numbers are an indication of drought conditions.

Standardized Precipitation Index:  An index that is determined by only one source, precipitation.  This indicator is based upon the probability of recording a given amount of precipitation for several time scales (from 1 month to 24 months) with negative values indicating drought conditions.

Objective Indicator Blends:  Likely the most complex indicator used takes into account both short term (1-3 months) and long term (6-60 months) time periods and is based upon many indices including precipitation, topsoil moisture, vegetation health index and other drought indices too.

All of these computerized calculations and numbers don’t always agree on the drought category, and that is why the final determination is  given by numerous climatologists from around the nation.  Have a question about the drought or the drought monitor, feel free to ask us!

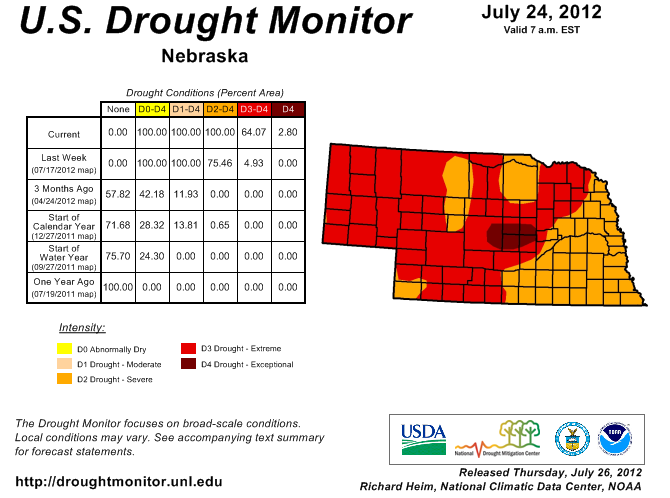
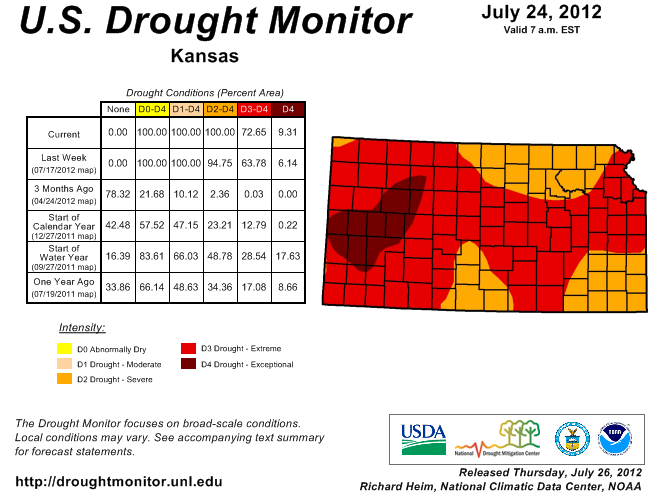
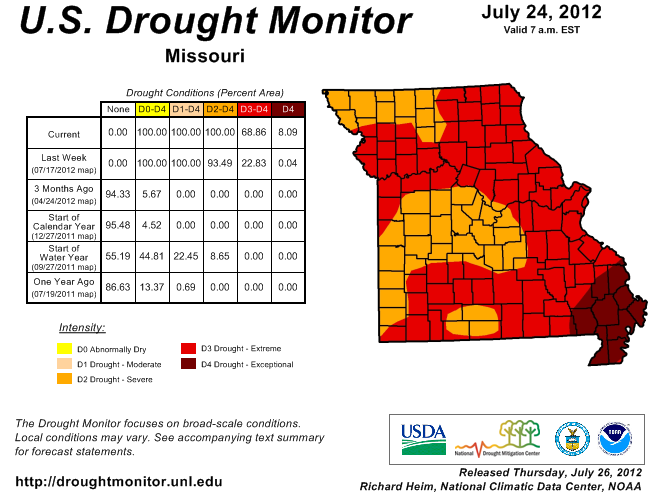
Drought Monitor (July 24, 2012)

July 26, 2012

The latest drought monitor has been released and the Central Plains saw conditions slightly worsen over the past week.  Although there was some rainfall that occurred this morning across the area, the latest update only includes precipitation through 6am CST on July 24.  The contiguous United States has just over 80% of the county with abnormally dry or worse conditions, a whopping 63.9% actually in some form of drought.  To make matters worse, over 20% of the country is in extreme or exceptional drought, first time since mid-February 2003.  Below is a closer look at individual states:


Nebraska

100% of the state is in severe or worse drought with a majority (64%) actually in extreme or worse.  Eastern Nebraska has managed some rain recently which has provided it with slightly better conditions, while the central portion of the state sees the first exceptional drought rating for Nebraska since July of 2004.  Like many other states, three months ago there was a single acre in Nebraska being designated in severe or worse drought, indicating just how quickly the lack of rainfall has built up.


Kansas

Kansas also has 100% of the state in severe or worse drought conditions with the latest drought update, and a large majority (over 72%) in extreme or exceptional drought.  Extreme drought covers much of western Kansas and extends across portions of the entire state, including the metro areas of Wichita, Topeka and the Kansas City area.  While less than a year ago there was nearly 18% of the state in exceptional drought compared to the current 9% the difference lies in the sheer expansive nature of this drought, only 75% of the state was in a form of drought then.


Missouri

As you could have expected, Missouri is another one of the four states that has 100% of their area in severe or worse drought (Iowa is the other along with Kansas and Nebraska).  The southeast portion of the state is hardest hit, where parts of 11 counties have been designated in exceptional or worse drought.  Extreme drought covers a large portion of the state, including the St. Louis Metro, Kansas City Metro and the cities of Springfield, Columbia and many more.  The cities of Jefferson City and Joplin are currently designated in only severe drought, however with little rain in sight for the next week they could see the extreme category in the next update.