Is this the beginning of another Dust Bowl?

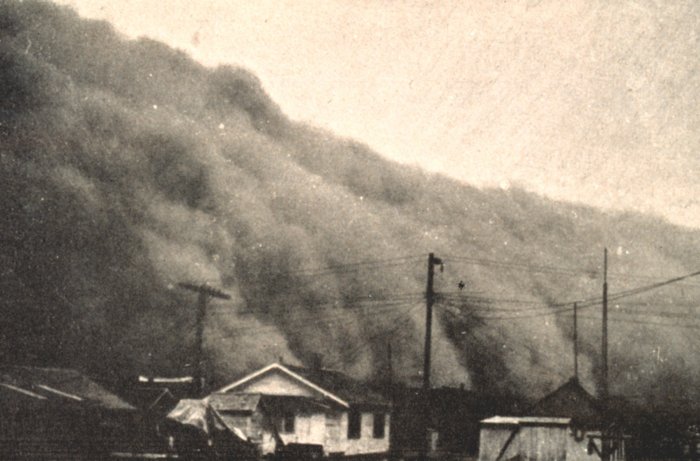
Dust Bowl - Kansas 1935

August 24, 2012

We’ve been hearing comparisons of this year’s drought to the Dust Bowl of the 1930’s all summer.  Are they really comparable?  While this year’s drought is extreme, it is still far from the peak of the Dust Bowl in 1934, which ranks #1 in terms of U.S. area covered by drought conditions.  In fact, July of 2012 ranks #20 in terms of area under moderate or worse drought conditions and #28 for area under severe or worse drought conditions.

Take a look at the Top 10 years for area of the contiguous U.S. covered by moderate or worse drought:

1) July 1934 – 79.9%
2) December 1939 – 62.1%
3) July 1954 – 60.4%
4) January 1955 – 58.3%
5) January 1940 – 57.7%
6) December 1956 – 57.6%
7) July 2012 – 57.2%
8) September 1931 – 54.9%
9) August 1936 – 54.4%
10) May 1925 – 54.0%


And the top 10 years for area of the contiguous U.S. covered in severe or worse drought:

1) July 1934 – 63.1%
2) September 1954 – 20.1%
3) December 1956 – 43.2%
4) August 1936 – 42.7%
5) January 1935 – 39.9%
6) January 1955 – 39.1%
7) July 2002 – 38.5%
8) July 2012 – 37.6%
9) August 2000 – 36.7%
10) July 1988 – 35.6


Could the Dust Bowl ever happen again?  Researchers say unlikely, as the Dust Bowl was largely contributed to lack of erosion-controlling farming practices and drought-sensitive crops such as wheat.  Agriculture was relatively new to the  Great Plains, and farmers were rapidly replacing native prairie grasses with wheat fields.  As the drought continued to expand and persisted the wheat fields failed, leaving exposed and barren top soil that was swept up by winds across Kansas, Oklahoma, Texas and other areas.  In fact, some researchers have indicated that humans helped cause the drought and heat in the 1930s due to the increasing barren land, along with the dust that was present throughout the atmosphere.  Much better farm practices and more drought-resistant crops will likely hinder a Dust Bowl scenario from ever happening again.


Exceptional Drought? How do they decide?

August 23, 2012

The personal and economic effects of our desperate need for water keeps drought related stories trending this summer.   You will see the latest Drought Monitor posted by the media, meteorologists and others alike that indicates classifications for areas that are in moderate, severe or exceptional drought.  What does an exceptional drought or a severe drought actually mean?

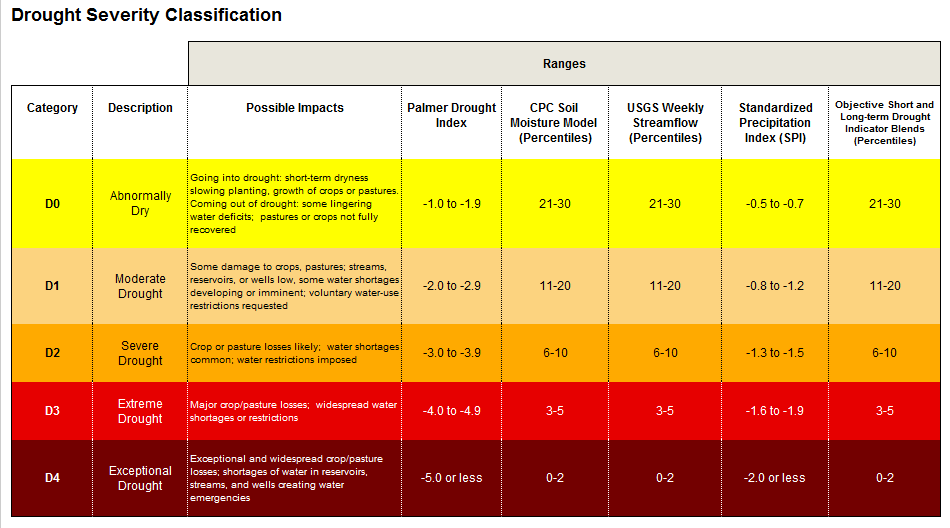
The labels are determined by using five key indicators, along with several other supplementary indicators, to determine the category of drought.  Examine this graphic, courtesy of the University of Nebraska-Lincoln, on each of these indicators and their corresponding values to a drought category.

Explanation of the US Drought Monitor

What do each of these indicators represent?

Palmer Drought Index:  Attempts to measure the duration and intensity of long-term drought-inducing patterns.  Not only taking the latest weather pattern, but patterns from previous months to determine a cumulative value ranging from over 5 (extremely moist) to less than -5 (extremely dry).  The index doesn’t just use precipitation either, it considers evaporation, runoff and other details too!

Soil Moisture Model:  The Climate Prediction Center uses data from 1932-2000 to determine a soil moisture percentile given the current conditions.  Percentiles are a comparison of current conditions to those of the past, meaning if the soil moisture is in the 0-2 percentile it is one of, if not the, lowest soil moisture that has ever been recorded for that location.

USGS Streamflow:  Another percentile, this one from the Geological Survey based upon streamflow of numerous rivers and streams throughout the United States.  The percentile is based upon at least 30 years worth of data for any specific streamflow station and just like the soil moisture percentile, low numbers are an indication of drought conditions.

Standardized Precipitation Index:  An index that is determined by only one source, precipitation.  This indicator is based upon the probability of recording a given amount of precipitation for several time scales (from 1 month to 24 months) with negative values indicating drought conditions.

Objective Indicator Blends:  Likely the most complex indicator used takes into account both short term (1-3 months) and long term (6-60 months) time periods and is based upon many indices including precipitation, topsoil moisture, vegetation health index and other drought indices too.

All of these computerized calculations and numbers don’t always agree on the drought category, and that is why the final determination is  given by numerous climatologists from around the nation.  Have a question about the drought or the drought monitor, feel free to ask us!


Is the Reprieve Here to Stay?

August 6, 2012

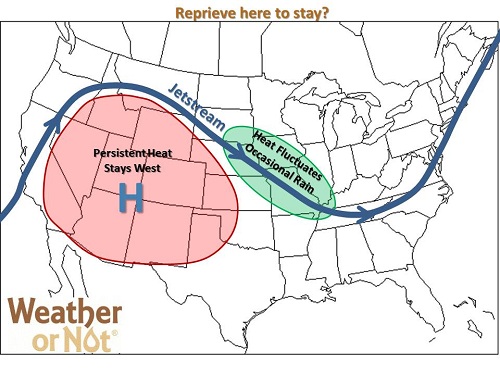
Expected Pattern 8-5

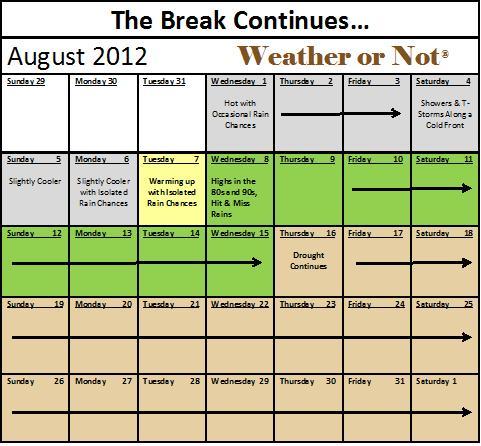
While rejoicing about this morning (lows 56 to 68), many are asking, will the persistent heat return? Thankfully, the answer is not yet. Earlier indications were that the scorching heat would return for the 10th through the 15th, but some welcome changes have occurred. Models now agree that the hot dome of high pressure stays west of the area, at least through the middle of next week. This means multiple cold fronts for the Missouri River Valley. Highs will climb above 90 ahead of the fronts, and drop below 90 behind the fronts, with no persistent 100+ stretches in sight. We look forward to occasional rain chances; not drought busting rains, but certainly welcome nonetheless. The jury is still out on the second half of the month. With the drought continuing, another heat wave could certainly be in store, but for now, watch for more pleasant days ahead!


8-5


July 2012: Record Breaking!

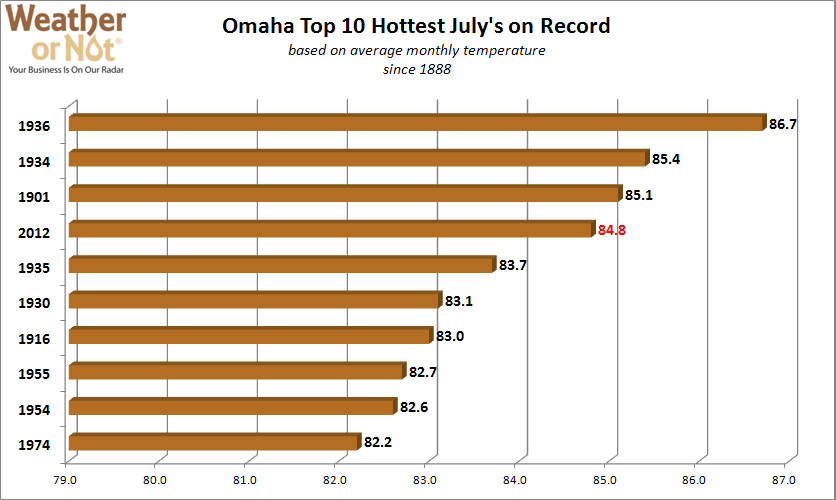
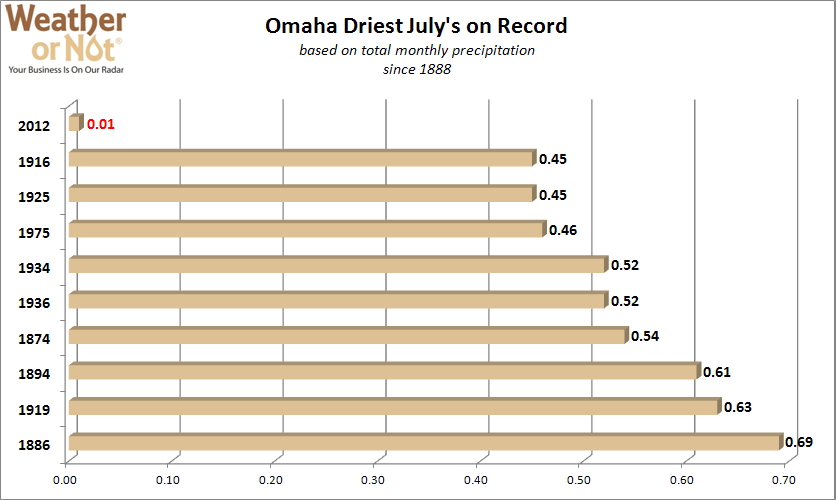
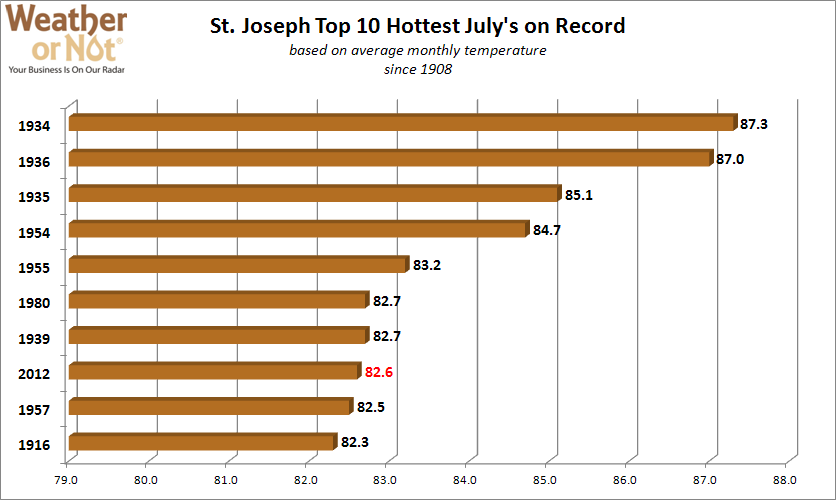
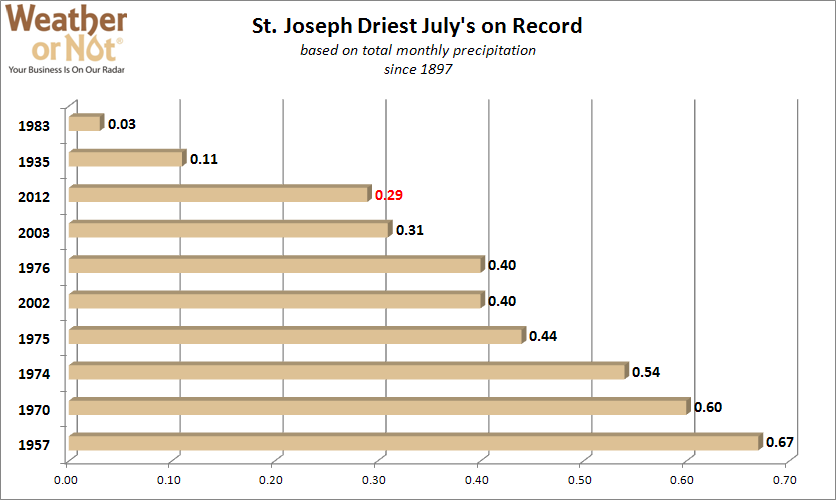
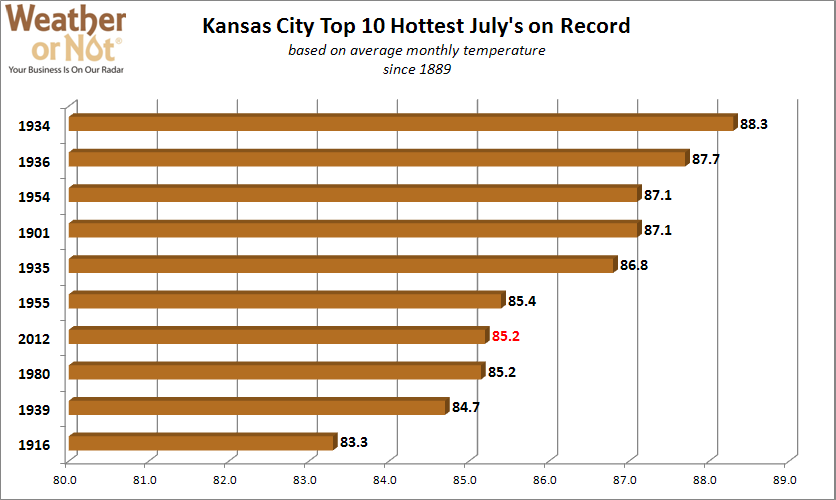
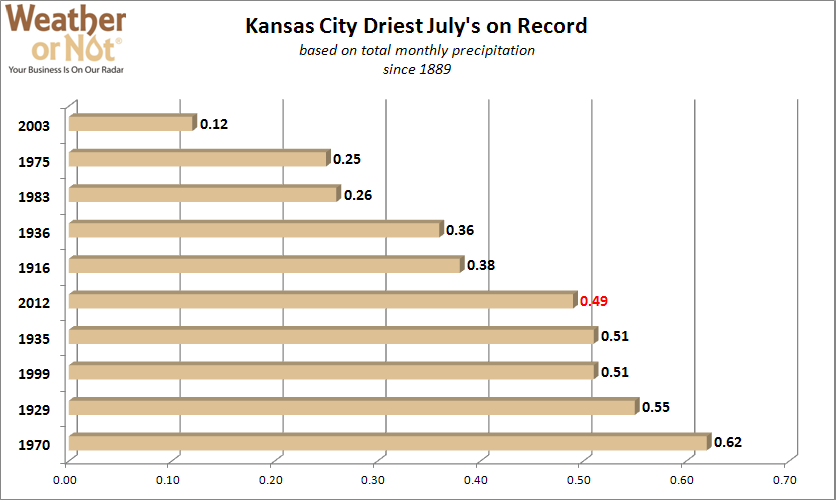
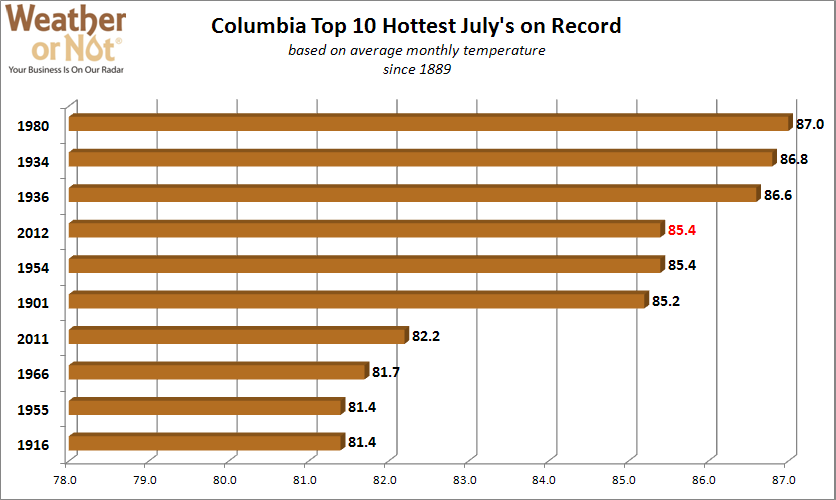
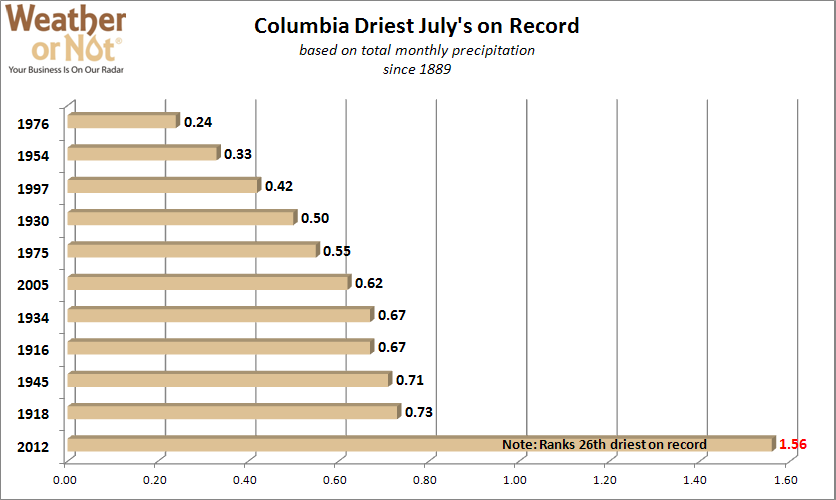
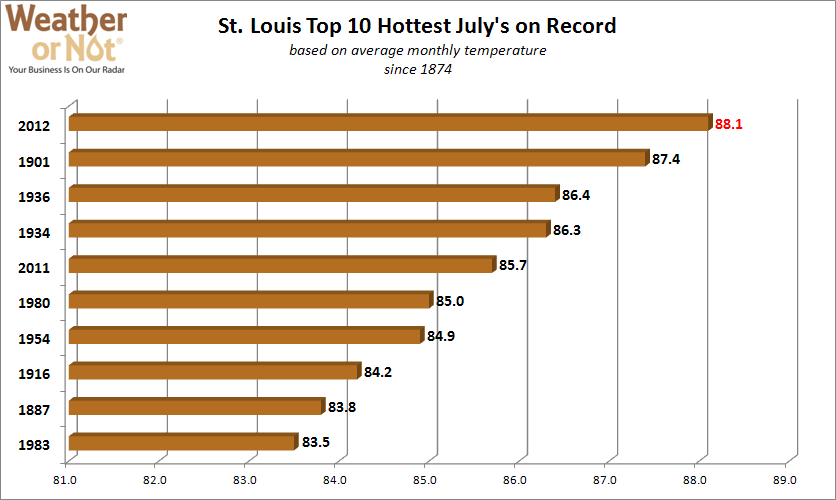
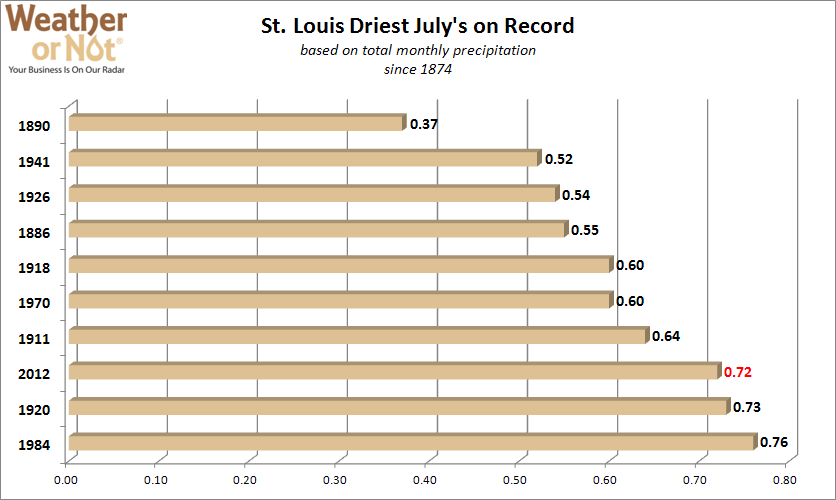
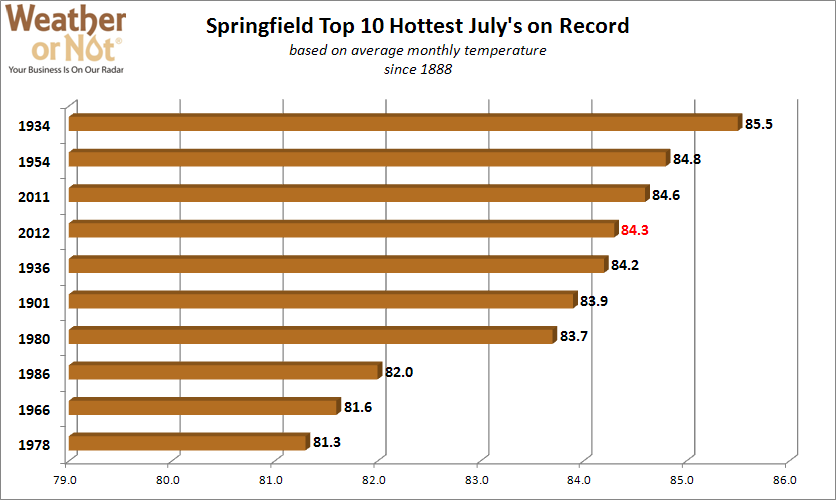
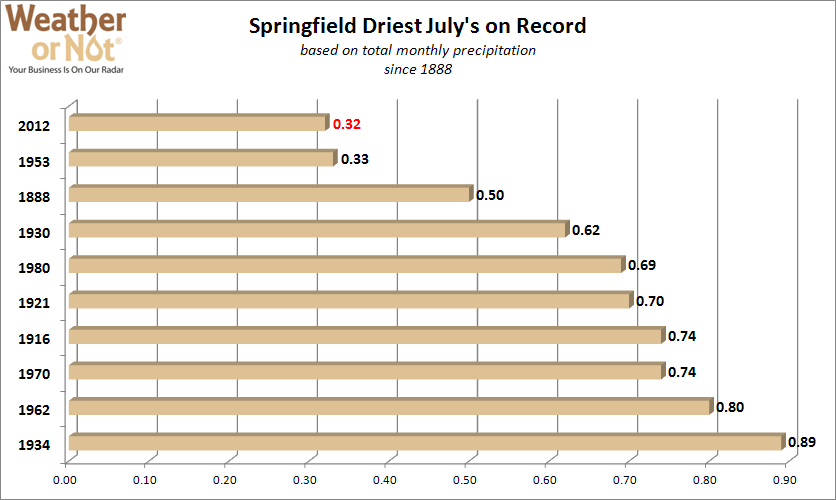
Most people across the region came to the conclusion that July was hot and dry, however just how hot and how dry?  We have gathered data for several cities across the area, finding the Top 10 hottest and Top 10 driest Julys on record. Each city had a July average temperature that ranked in the Top 10, with St. Louis having the hottest July on record.  While it was also dry across the region, the precipitation numbers vary a lot more than temperature as isolated thunderstorms provided hit and miss rainfall.  For example, Omaha managed to have their driest July on record with only 0.01″ of precipitation, which also ranks as their sixth driest month ever!  Meanwhile, Columbia managed to see a few of those hit and miss thunderstorms, which led to 1.56″ of precipitation, making it their 26th driest July.  Check out how your city ranks with the graphs below:


Omaha, NE

St. Joseph, MO

Kansas City, MO

Columbia, MO

St. Louis, MO

Springfield, MO


Olathe Girls Softball Took Action

GAME OVER.  Lightning warnings from Weather or Not had already caused Dave Jones, OGSA General Manager, to send players and patrons home.  Storms would not move from the area for several hours so “waiting it out” was not an option.  Some players and families were still lingering in the area when the tornado warning was issued, Dave calmly alerted the remaining bystanders to take shelter immediately.  Read more on how the storms on Sunday posed a threat to crowds at public athletic fields.


Large Hail Pounds St. Louis Metro

Several rounds of severe weather rolled through the St. Louis Metro April 28, 2012, with numerous reports of large hail. The first severe thunderstorm moved into western St. Charles County shortly after 2:30pm, dropping golf ball sized hail near Wentzville, MO.  This storm continued east, into St. Charles around 3:15pm with 1.0-1.5″ diameter hail, then into Florissant, Bridgeton and Hazelwood area around 3:25pm with quarter sized to more golf ball sized hail.  St. Louis-Lambert International Airport reported quarter sized (1.0″ diameter) hail at approximately 3:27pm.  This initial storm then moved over northern suburbs of St. Louis City and crossed over to Granite City, IL at 3:40pm.  While severe winds were not reported, gusts up to 50 mph did occur with the thunderstorm as it moved through the metro and unfortunately caused many injuries in St. Louis.

A second severe thunderstorm took a similar path into the St. Louis Metro a couple of hours later, dropping baseball sized hail in Wentzville shortly before 5:30pm.  Both O’Fallon and St. Charles had reports of baseball sized hail at 5:48pm and 5:59pm respectively as the storm continued east-southeast.  It was shortly after this that doppler radar began to indicate low-level rotation with this storm and a tornado warning was issued for areas of St. Louis County and St. Louis City.  While a tornado warning was in effect, reports continued to come in of large hail with golf ball sized hail reported in Maryland Heights, Creve Coeur and St. Ann.  The storm moved into St. Louis City at 6:15pm with continued reports of golf ball to baseball sized hail, including a 3″ diameter hail report near the Edward Jones Dome.  Reports of hail continued to come in across St. Louis City for nearly 15 minutes before the storm finally moved across the river shortly after 6:30pm.  No Tornado was ever reported with this storm.  Additional thunderstorms overnight produced heavy rains and additional hail reports under 1-inch to go along with gusty winds near 45 mph.

You can view many of the large hail reports from across the area in the map below:

Large Hail Reports - St. Louis April 28, 2012

Large Hail Reports – St. Louis April 28, 2012


Facilities Managers Like These Numbers

“Warmer weather this winter has given all our facilities an added bonus in cost reductions,” says Steve Byrne, Vice President Corporate Facilities Group, Commerce Bank.  “Coupled with the drop in natural gas prices, our budget likes this winter a whole lot more than last year.”

When Facilities Managers want to measure the demand for energy at their businesses, they compare Heating Degree Days (HDD).  The examples below show why utility bills this winter should not only come in lower than last year, but lower than normal.

Heating Degree Days Comparison

Heating Degree Days Comparison


Nature’s Own Roller Coaster

While temperatures this winter have widely remained above normal, that doesn’t mean we haven’t had our fair share of ups and downs.  The middle of January featured one such roller coaster of temperatures with highs ranging from just below normal to well above normal and back. Take a look at these cities and how big their rises and falls were:

Kansas City, MO  –  St. Joseph, MO  –  St. Louis, MO  –  Columbia, MO  –  Jefferson City, MO  –  Springfield, MO  –  Omaha, NE  –  Lawrence, KS  –  Topeka, KS  –  Manhattan, KS  –  Salina, KS


Kansas City High Temperatures