Is your business ready to shift gears as quickly as the RNC?

August 28, 2012

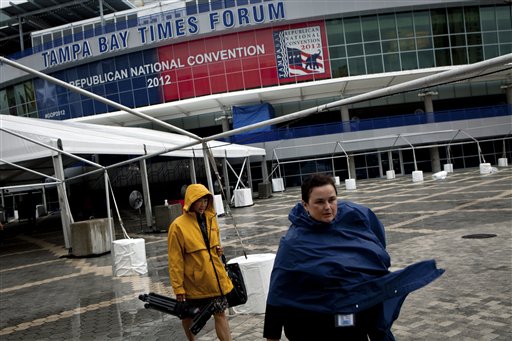
The Republican National Convention had extensive plans in the works for more than a year; speakers, media coverage, travel arrangements, catering, venue preparations, etc.  Hurricane Isaac made them scramble behind the scenes.  Organizers adapted quickly, and then publicized their changes clearly.  Decisive action kept participants directly on track and far from any behind-the-scenes chaos.

How will your event operations handle disruptions when weather threatens?  What can you do to:

  • Mitigate revenue loss
  • Maintain customer participation
  • Keep workers focused
  • Utilize public relations

Max Whittaker/The New York Times

SOLUTIONS

Create a Deadline:  How much time will be needed for effective, calm action? The RNC couldn’t wait for the tropical storm to arrive before they took action.  Use what you know about your business to create options ahead of time.

Deposits:  What non-refundable money can you reasonably require?

Rain Insurance This policy may cover mandatory costs such as entertainment or your deposits.  If you can’t make money at least try not to lose any!

Social & Traditional Media:  Get the word out ASAP!  Many had heard that the RNC cancelled two days of convention activities before they had ever started following Isaac.

Before any event, prioritize its purpose.  What’s the critical “Take Away”?  Identify the activities that directly support your objectives and create the most flexibility for executing them.  That way, when an emergency disrupts the original plan, viable options will be handy.

Being a leader, whether it’s hosting a celebratory event or a strategic national planning meeting, is a very Darwinian role.  Adaptability = Success.  Having your goals, priorities and options identified ahead of time will create a seamless success for participants and ultimately maximize your bottom line.

As we’re seeing this week, nothing changes faster than the weather.  Weather or Not works with companies, government agencies and airports 24/7.  Our clients have plenty of time to adjust their operations, thereby maximizing benefits while minimizing budgets.


What Action Will Your Business Take?

Lessons Learned: A series of lessons learned from past disasters. Weather or Not will highlight one topic each month to help you prepare for severe storms.

Businesses and organizations encounter unique challenges as they devise the most successful preparedness action plan for their employees and patrons.  President, Sara Croke explains the questions companies should be asking to give them plenty of time to act when disaster threatens their business in the current issue of Thinking Bigger Media.


From Wash Out to the Big Time

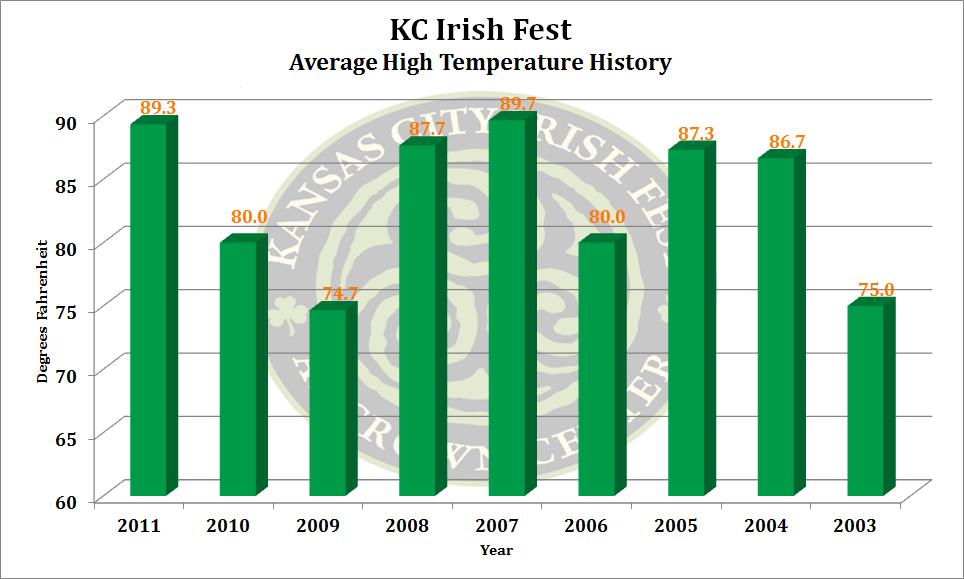
Ten years ago, several KC Irish organizations got together and asked, “How can we work to benefit the community as a whole?”  Being sociable sorts, they put fun first on their agenda.


Irish Fest Temperature History

Historical Temperatures

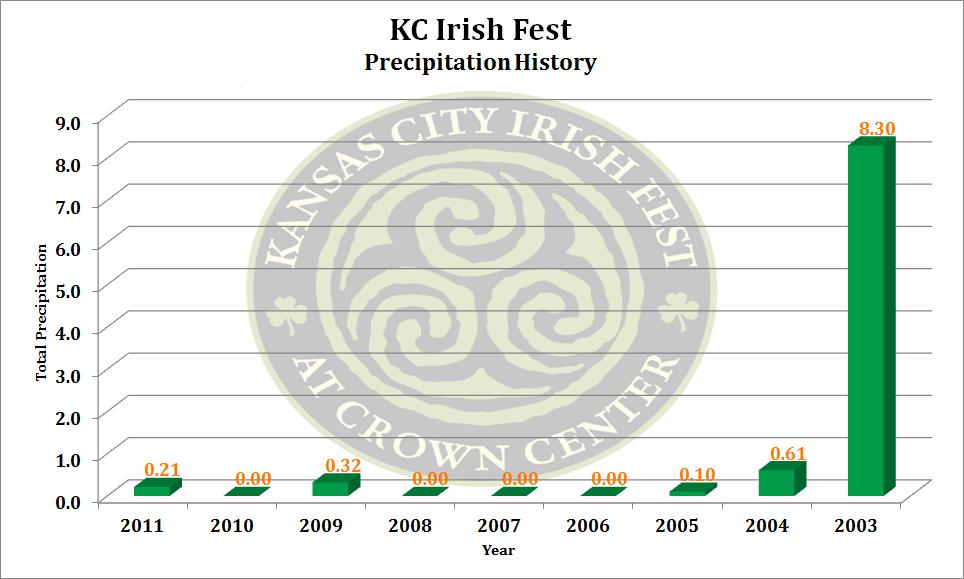
Irish Fest Historical Precipitation

Historical Precipitation


Mother Nature doused their event, but not their spirits!  8.03″ of soaking rain turned the venue into a mud pit.  A stubborn lot, especially where parties are concerned, organizers persevered to create Kansas City’s largest annual festival.  Come join in the fun this Labor Day weekend!


Why Soakers Missed KC Saturday Night

Sunday, August 26, 2012

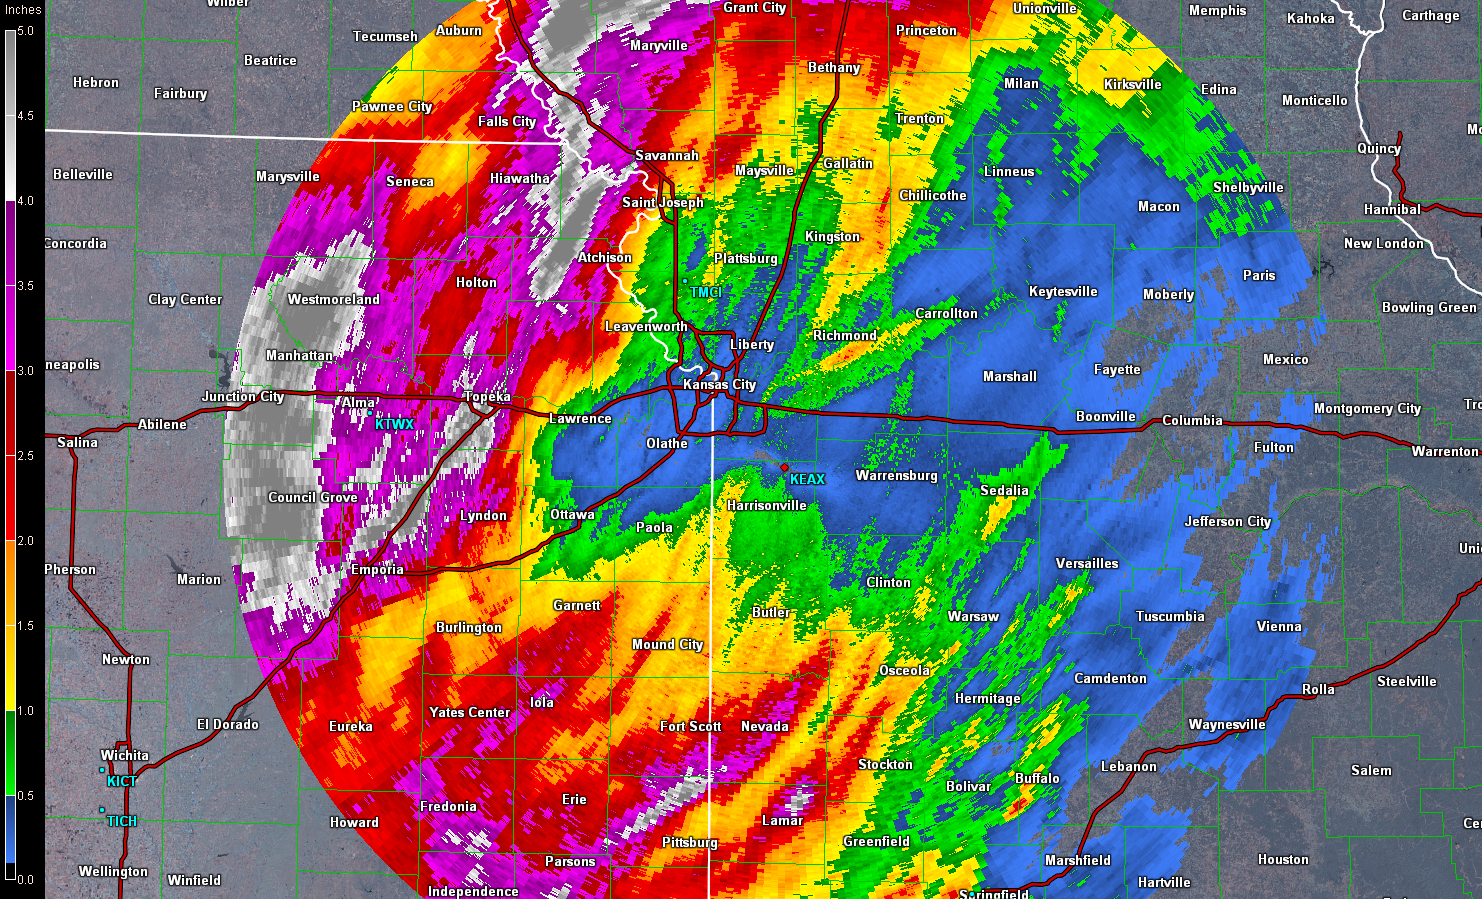
A slow-moving storm brought soaking rainfall to the Central Plains over the last few days.  Topeka recorded a daily record of 2.55” of rain for August 25th. Milford Kansas, just west of Manhattan, recorded a whopping 6.01” of rain from this storm!

1-2 inches of rainfall looked like a good bet for Kansas City Saturday night.  Many lawns were eagerly awaiting a good drink of H20, but it didn’t happen for Kansas City.

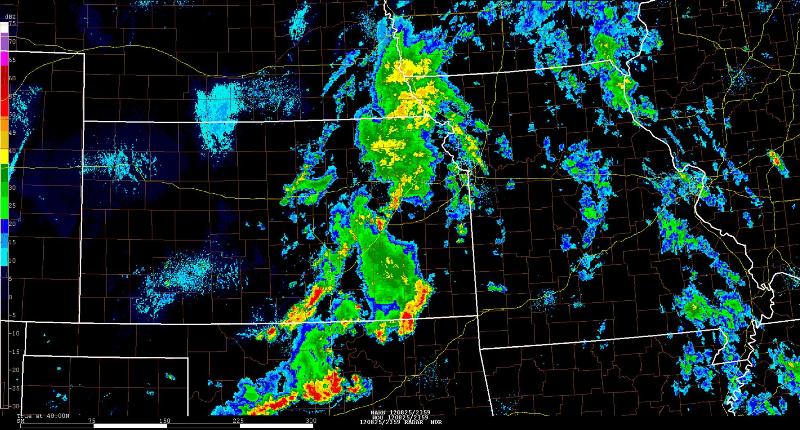
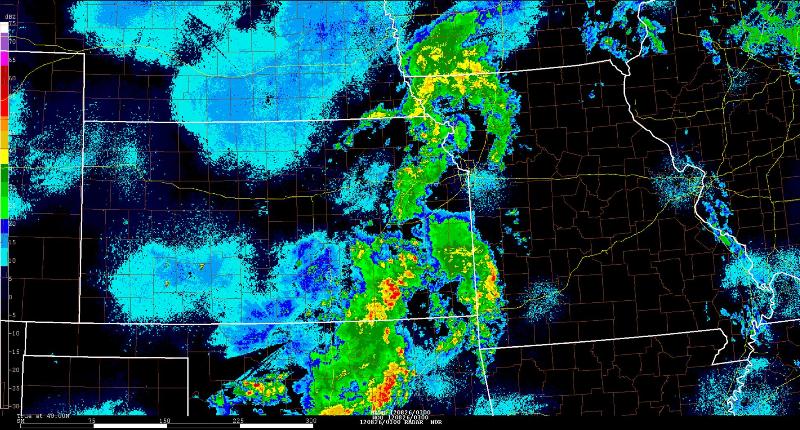
The radar screenshot from ~7pm Saturday evening (left-below) shows widespread thunderstorms developing west and southwest of Kansas City.  An increase in winds just above the surface along with a warm, moist fetch of air from the Gulf of Mexico was expected to sustain the storms as they moved into the area. Taking a closer look, you can see a cluster of thunderstorms ahead of the main rain band straddling the Kansas/Oklahoma border.  Thunderstorms had been moving northeast throughout the day, which is why Kansas City had good reason to be hopeful.


Regional Radar - August 25, 2012 at 6:59pm

Regional Radar 6:59pm

Regional Radar - August 25, 2012 at 10:00pm

Regional Radar 10:00pm


The next radar screenshot (right-above) is just three hours later at 10pm. The cluster of thunderstorms that was along the border raced eastward into Missouri. This cut off our supply of moisture and dashed any hope of significant rainfall.  Unfortunately, this created a void over Kansas City as shown below.


Storm Total Precipitation through 12pm August 26, 2012

Storm Total Precipitation


Much Needed Rain for Central Plains

Saturday, August 25

It has been at least 65 days since any of the locations listed below have had an inch or more rain in a single day.  For Kirksville, Missouri it has been a whopping 134 days!

While areas of Kansas and northwest Missouri have already seen significant rain, for the rest of Missouri it brings up an interesting question.

When was the last time it rained an inch in a single day?


Kirksville, MO –  April 13
Sedalia, MO –  April 29
Joplin, MO –  May 31
St. Louis, MO –  June 11
Kansas City International –  June 11
Downtown Kansas City –  June 11
St. Joseph, MO –  June 11
Columbia, MO –  June 16
Jefferson City, MO –  June 16
Chillicothe, MO –  June 16
Olathe, KS –  June 21
Lee’s Summit, MO –  June 21


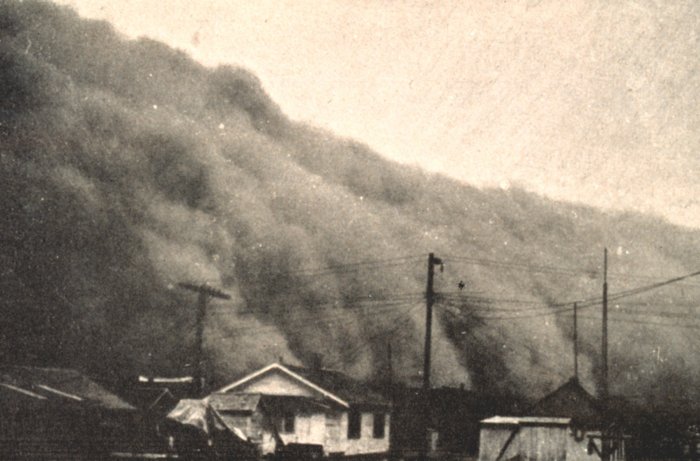
Is this the beginning of another Dust Bowl?

Dust Bowl - Kansas 1935

August 24, 2012

We’ve been hearing comparisons of this year’s drought to the Dust Bowl of the 1930’s all summer.  Are they really comparable?  While this year’s drought is extreme, it is still far from the peak of the Dust Bowl in 1934, which ranks #1 in terms of U.S. area covered by drought conditions.  In fact, July of 2012 ranks #20 in terms of area under moderate or worse drought conditions and #28 for area under severe or worse drought conditions.

Take a look at the Top 10 years for area of the contiguous U.S. covered by moderate or worse drought:

1) July 1934 – 79.9%
2) December 1939 – 62.1%
3) July 1954 – 60.4%
4) January 1955 – 58.3%
5) January 1940 – 57.7%
6) December 1956 – 57.6%
7) July 2012 – 57.2%
8) September 1931 – 54.9%
9) August 1936 – 54.4%
10) May 1925 – 54.0%


And the top 10 years for area of the contiguous U.S. covered in severe or worse drought:

1) July 1934 – 63.1%
2) September 1954 – 20.1%
3) December 1956 – 43.2%
4) August 1936 – 42.7%
5) January 1935 – 39.9%
6) January 1955 – 39.1%
7) July 2002 – 38.5%
8) July 2012 – 37.6%
9) August 2000 – 36.7%
10) July 1988 – 35.6


Could the Dust Bowl ever happen again?  Researchers say unlikely, as the Dust Bowl was largely contributed to lack of erosion-controlling farming practices and drought-sensitive crops such as wheat.  Agriculture was relatively new to the  Great Plains, and farmers were rapidly replacing native prairie grasses with wheat fields.  As the drought continued to expand and persisted the wheat fields failed, leaving exposed and barren top soil that was swept up by winds across Kansas, Oklahoma, Texas and other areas.  In fact, some researchers have indicated that humans helped cause the drought and heat in the 1930s due to the increasing barren land, along with the dust that was present throughout the atmosphere.  Much better farm practices and more drought-resistant crops will likely hinder a Dust Bowl scenario from ever happening again.


Exceptional Drought? How do they decide?

August 23, 2012

The personal and economic effects of our desperate need for water keeps drought related stories trending this summer.   You will see the latest Drought Monitor posted by the media, meteorologists and others alike that indicates classifications for areas that are in moderate, severe or exceptional drought.  What does an exceptional drought or a severe drought actually mean?

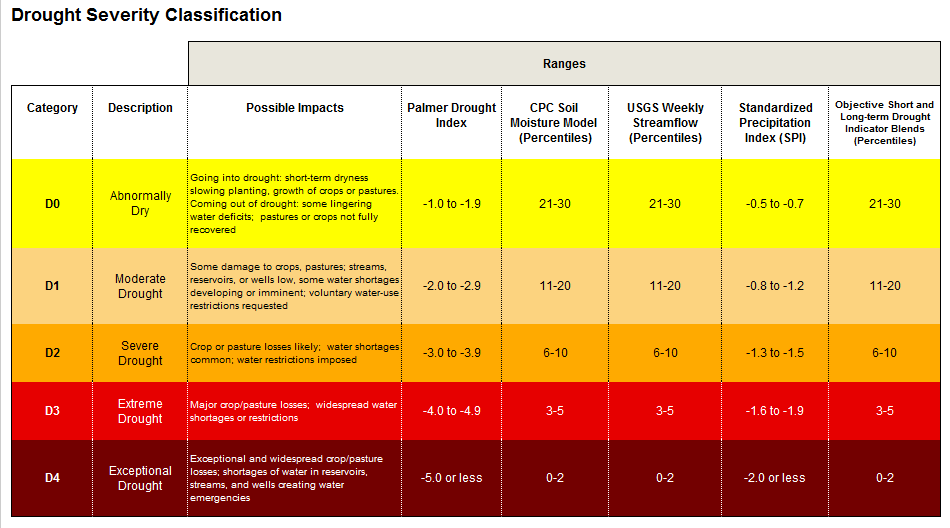
The labels are determined by using five key indicators, along with several other supplementary indicators, to determine the category of drought.  Examine this graphic, courtesy of the University of Nebraska-Lincoln, on each of these indicators and their corresponding values to a drought category.

Explanation of the US Drought Monitor

What do each of these indicators represent?

Palmer Drought Index:  Attempts to measure the duration and intensity of long-term drought-inducing patterns.  Not only taking the latest weather pattern, but patterns from previous months to determine a cumulative value ranging from over 5 (extremely moist) to less than -5 (extremely dry).  The index doesn’t just use precipitation either, it considers evaporation, runoff and other details too!

Soil Moisture Model:  The Climate Prediction Center uses data from 1932-2000 to determine a soil moisture percentile given the current conditions.  Percentiles are a comparison of current conditions to those of the past, meaning if the soil moisture is in the 0-2 percentile it is one of, if not the, lowest soil moisture that has ever been recorded for that location.

USGS Streamflow:  Another percentile, this one from the Geological Survey based upon streamflow of numerous rivers and streams throughout the United States.  The percentile is based upon at least 30 years worth of data for any specific streamflow station and just like the soil moisture percentile, low numbers are an indication of drought conditions.

Standardized Precipitation Index:  An index that is determined by only one source, precipitation.  This indicator is based upon the probability of recording a given amount of precipitation for several time scales (from 1 month to 24 months) with negative values indicating drought conditions.

Objective Indicator Blends:  Likely the most complex indicator used takes into account both short term (1-3 months) and long term (6-60 months) time periods and is based upon many indices including precipitation, topsoil moisture, vegetation health index and other drought indices too.

All of these computerized calculations and numbers don’t always agree on the drought category, and that is why the final determination is  given by numerous climatologists from around the nation.  Have a question about the drought or the drought monitor, feel free to ask us!


Low Water on Mississippi River

In an ongoing saga between the drought and the Mississippi River, the Coast Guard and Army Corp of Engineers have been facing a constant battle in keeping the river open to boat and barge traffic.  The U.S. Coast Guard closed an 11-mile stretch of the river on Monday, August 20 after a ship ran aground while traveling near Greenville, Mississippi which has been closed intermittently since July.  Other portions of the river are staying open thanks to constant dredging.

A recent New York Times article spotlighted an individual dredge that is working just south of St. Louis.  The dredge Potter is said to be sucking up about 60,000 cubic yards of sediment from the bottom of the river and depositing it to the side.  The Potter is one of more than a dozen dredges out working on the river to keep traffic moving which is vital to the economy, with barges hauling grain, petroleum and coal among other products daily.  Inland waterways carry 60% of the nation’s grain exports, 22% of domestic petroleum and 20% of the coal used to generate electricity with a majority moving over the Mississippi and Ohio rivers.


How low is the Mississippi?

The river gauge at St. Louis has an observed value of -0.74 feet, 17th lowest on record (-6.10 feet on 01/16/1940 is record low).

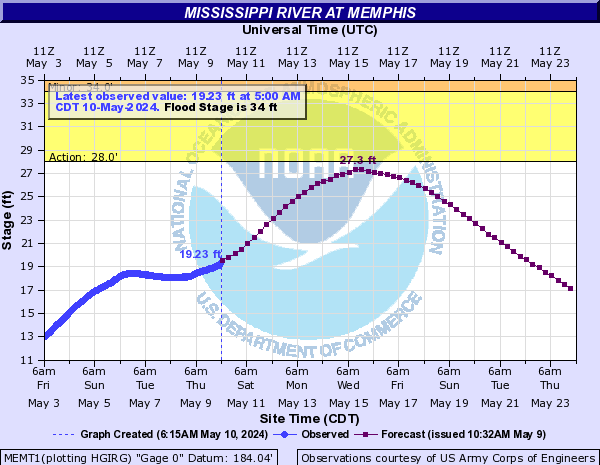
Memphis, Tennessee’s river gauge has an observed value of -8.73 feet, 4th lowest on record (-10.70 feet on 02/10/1937 is record low).

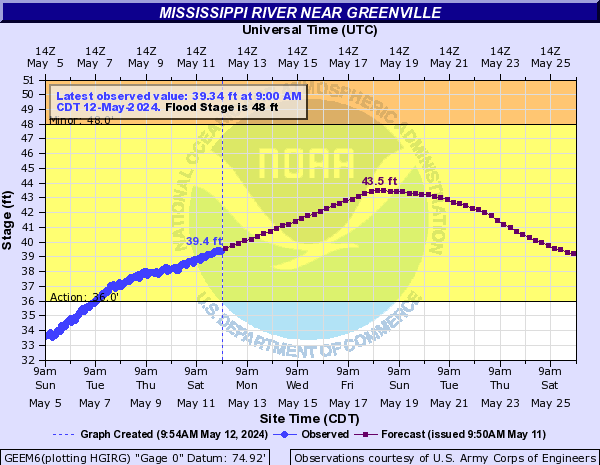
Greenville, Mississippi (near where the river has been closed) has a river level of 7.75 feet, 6th lowest on record (6.70 feet is record low on 01/04/1964).


Check out the hydrograph of each of those river gauges with the images below (will update automatically to the latest river levels).


St. Louis

St. Louis

St. Louis

Memphis

Greenville

Greenville


Recipe for Record Lows

August 20, 2012

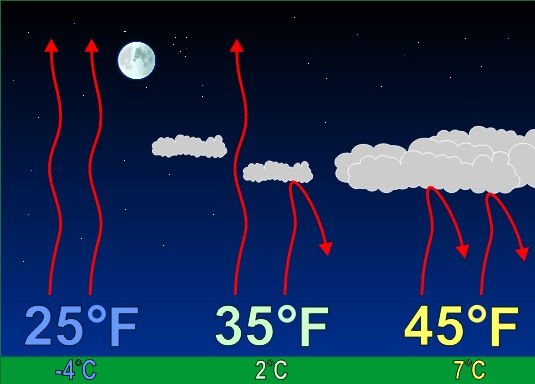
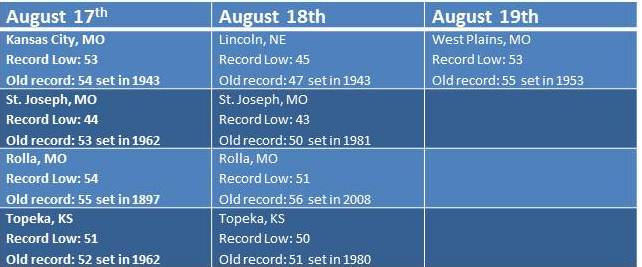
Low dewpoints, clear skies and light winds were the perfect recipe for record low temperatures this weekend. Let’s take a look at how each of these factors contributed to some cool mornings…

START WITH – Low Dewpoints: The dewpoint is a measure of the amount of moisture in the atmosphere. When dewpoints climb above 60 degrees in the summer, the air feels warm and muggy. Warm dewpoints on a summer night also limit cooling. This is because as the air temperature gets close to the dewpoint, relative humidity increases and condensation occurs. The process of condensation releases heat into the air causing the temperature to level-off near the dewpoint. So when the dewpoint is lower, that “level-off” happens at a lower temperature. That was the case this weekend as dewpoints dropped into the 40s.

ADD IN – Clear Skies: Starry skies are needed for temperatures to fall close to the dewpoint. During the day pavement, buildings, vegetation and soil absorb heat from the sun. During the night, that heat gets released back toward space. When the nighttime sky is cloudy, those clouds act like a blanket at night, keeping temperatures warm. However, when the nighttime sky is clear, heat released from earth escapes into space causing temperatures to drop. Locations that saw record lows this weekend all had clear skies for a majority of the night.


In winter, we welcome the cloudy blanket for warmth.

MIX WITH – Light Winds: Wind speed is the final factor in how low temperatures can fall. Since air normally cools from the ground up, the air closest to the ground is the coolest overnight. As you increase in elevation off the ground, the temperature normally gets warmer. If the wind is strong overnight, the cool air near the surface mixes with the warmer air above, which limits the potential for cooling. However, on a night with light winds, the air near the ground continues to cool with no influence from warm air above. Wind speeds were generally less than 5 mph this weekend.


Coolest Air Since June Coming!

August 11, 2012

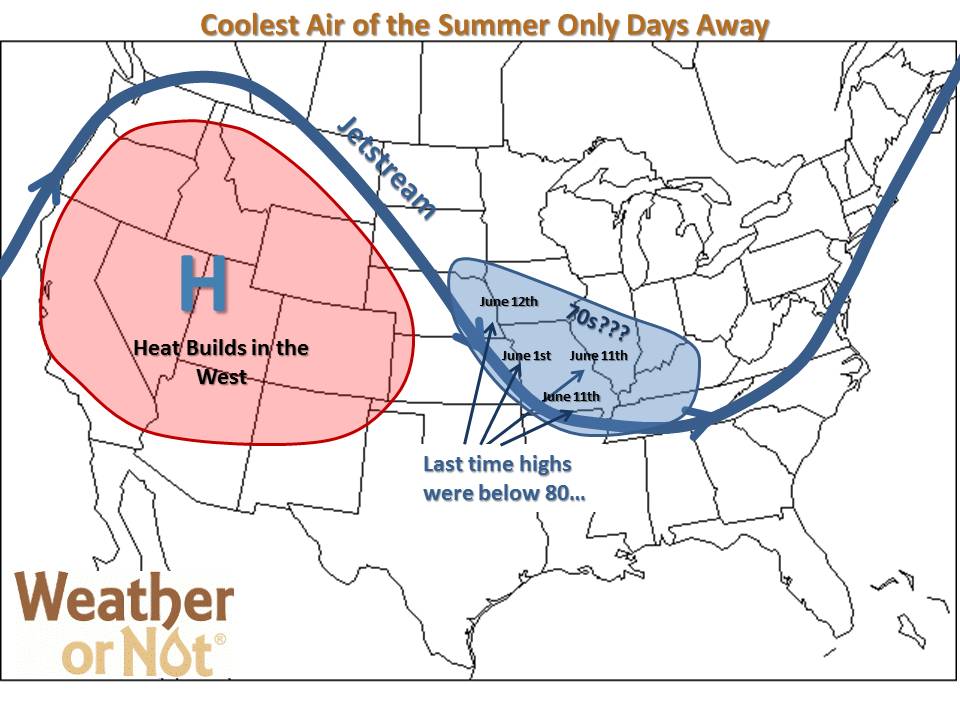
A couple weeks ago we were begging for highs below 100; would it be crazy to hope for the 70s? The last time the Missouri River Valley saw high temperatures below 80 was in early June.  After the hottest July on the planet, a few days in August might not get out of the 70s.

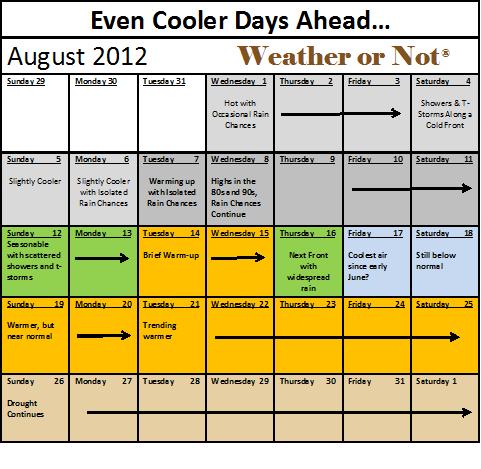
Expected Pattern for AugustModels are coming into agreement that a fairly strong trough of low pressure will dive southward this Thursday into Friday opening the door to cool Canadian air. Highs could potentially drop 10-15 degrees below normal in some locations. While it’s still early to pinpoint exactly how cool we will get, triple digits are history for now.

When will the heat return?  The first signs of any heat returning are during the following week, but models are unclear on how hot it will get, and how long the heat could last.  For now, bring on the 70s!

August Outlook